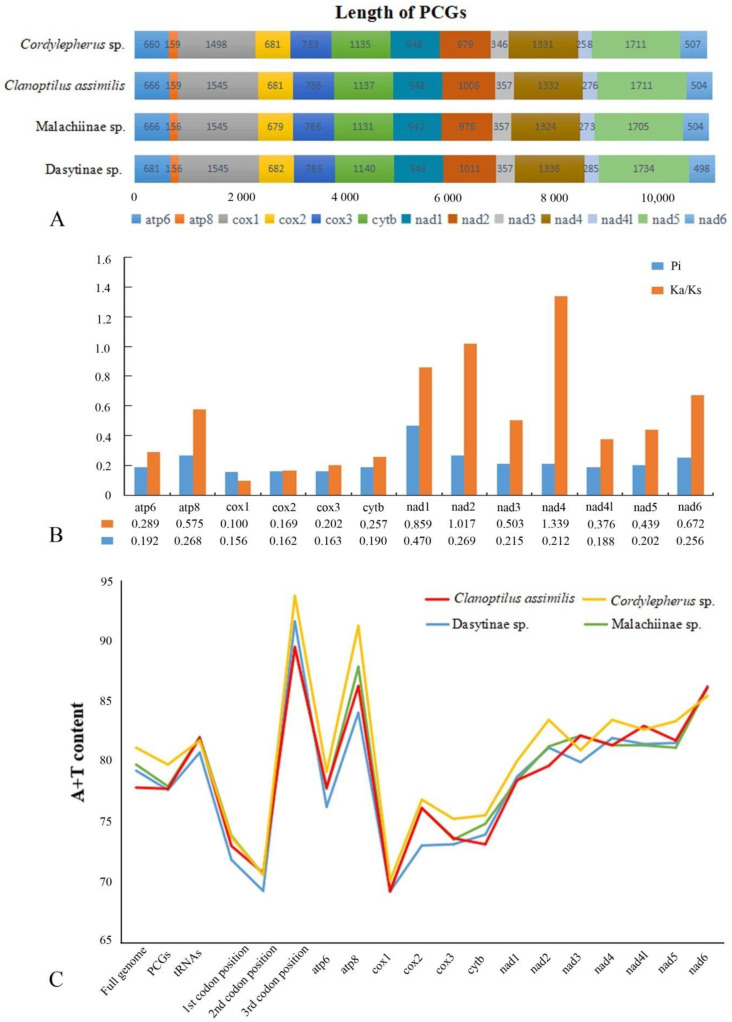
Figure 3.
(A) Comparison of 13 PCGs in lengths of Melyridae species; (B) nucleotide diversity (Pi) and nonsynonymous (Ka) to synonymous (Ks) substitution rate ratios of 13 PCGs of Melyridae species (the Pi and Ka/Ks values of each PCGs shown under the gene name); (C) comparison of AT contents in different regions of mitogenomes of Melyridae species.

