
Fig. 1.
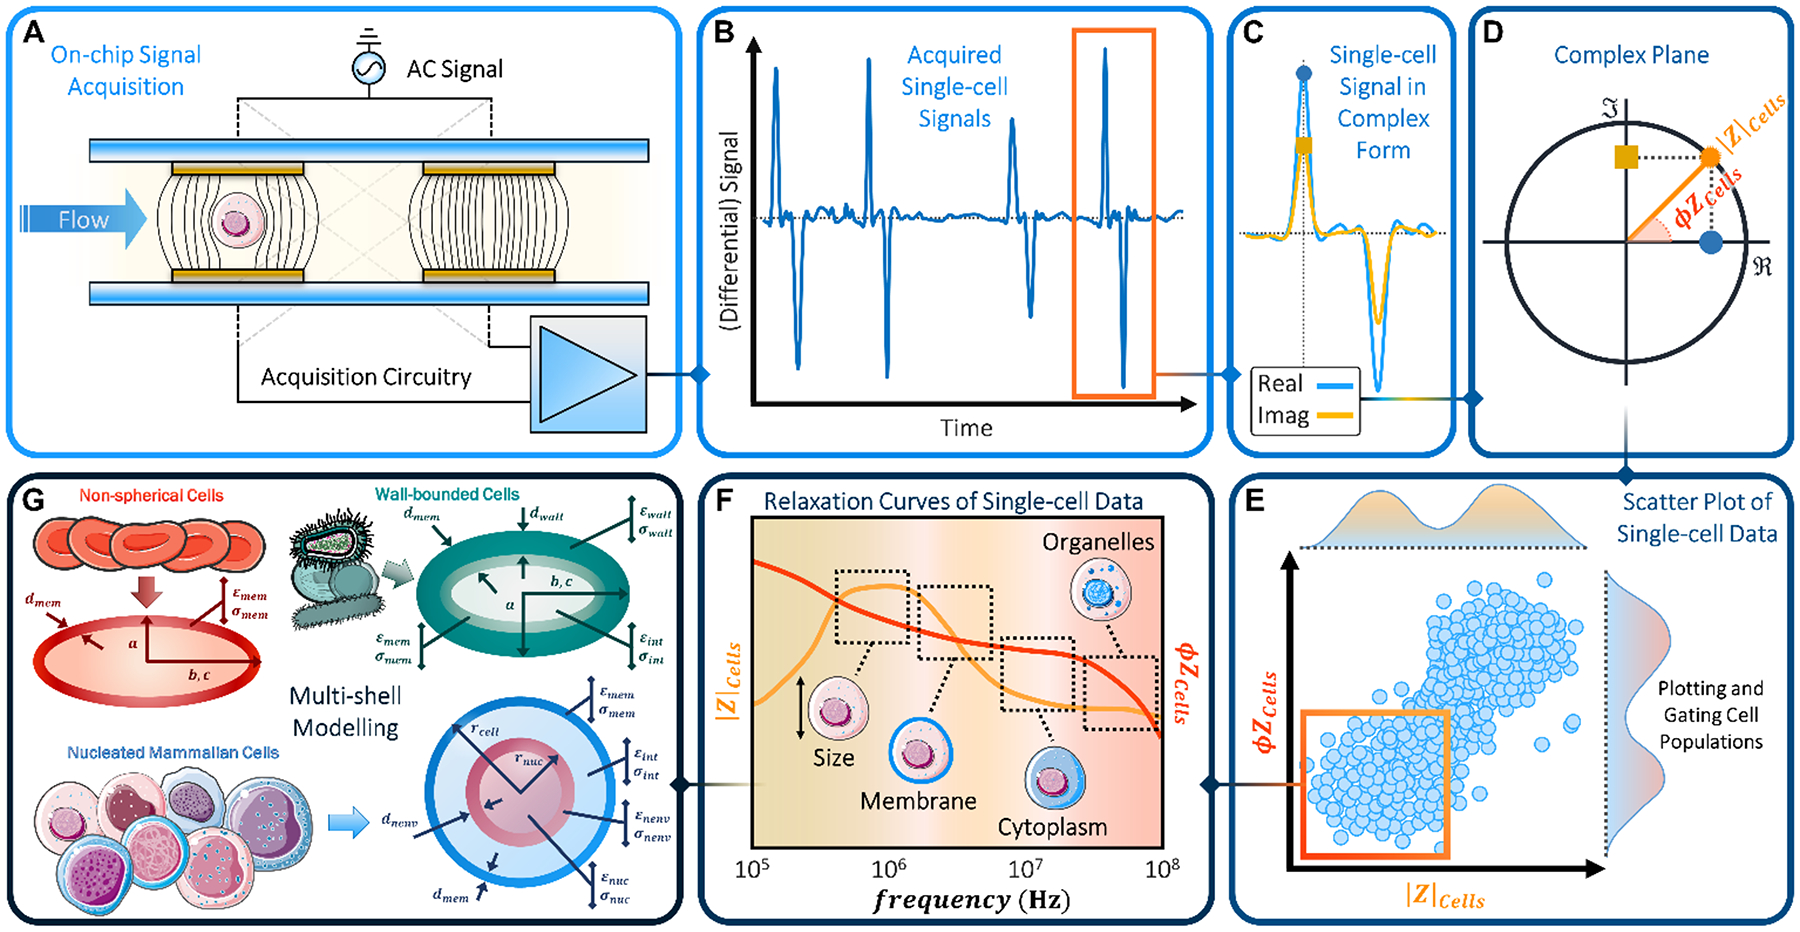
Overview of impedance-based cell phenotyping. (A) Typical measurement setup: a multifrequency AC voltage signal is applied to the top electrodes and the differential current from the bottom electrodes is measured. (B) Acquired signal (real part, one frequency channel). (C) Single-cell signal (real and imaginary parts). Markers highlight peak values. (D) Peak amplitude representation in the complex plane, showing impedance magnitude (|Z|) and impedance phase (φZ). (E) Scatter plot of single-cell data (phase vs. magnitude). (F) Spectra of impedance magnitude and phase, with indication of the cellular features probed in each frequency range. (G) Multi-shell models used to fit the impedance spectra.