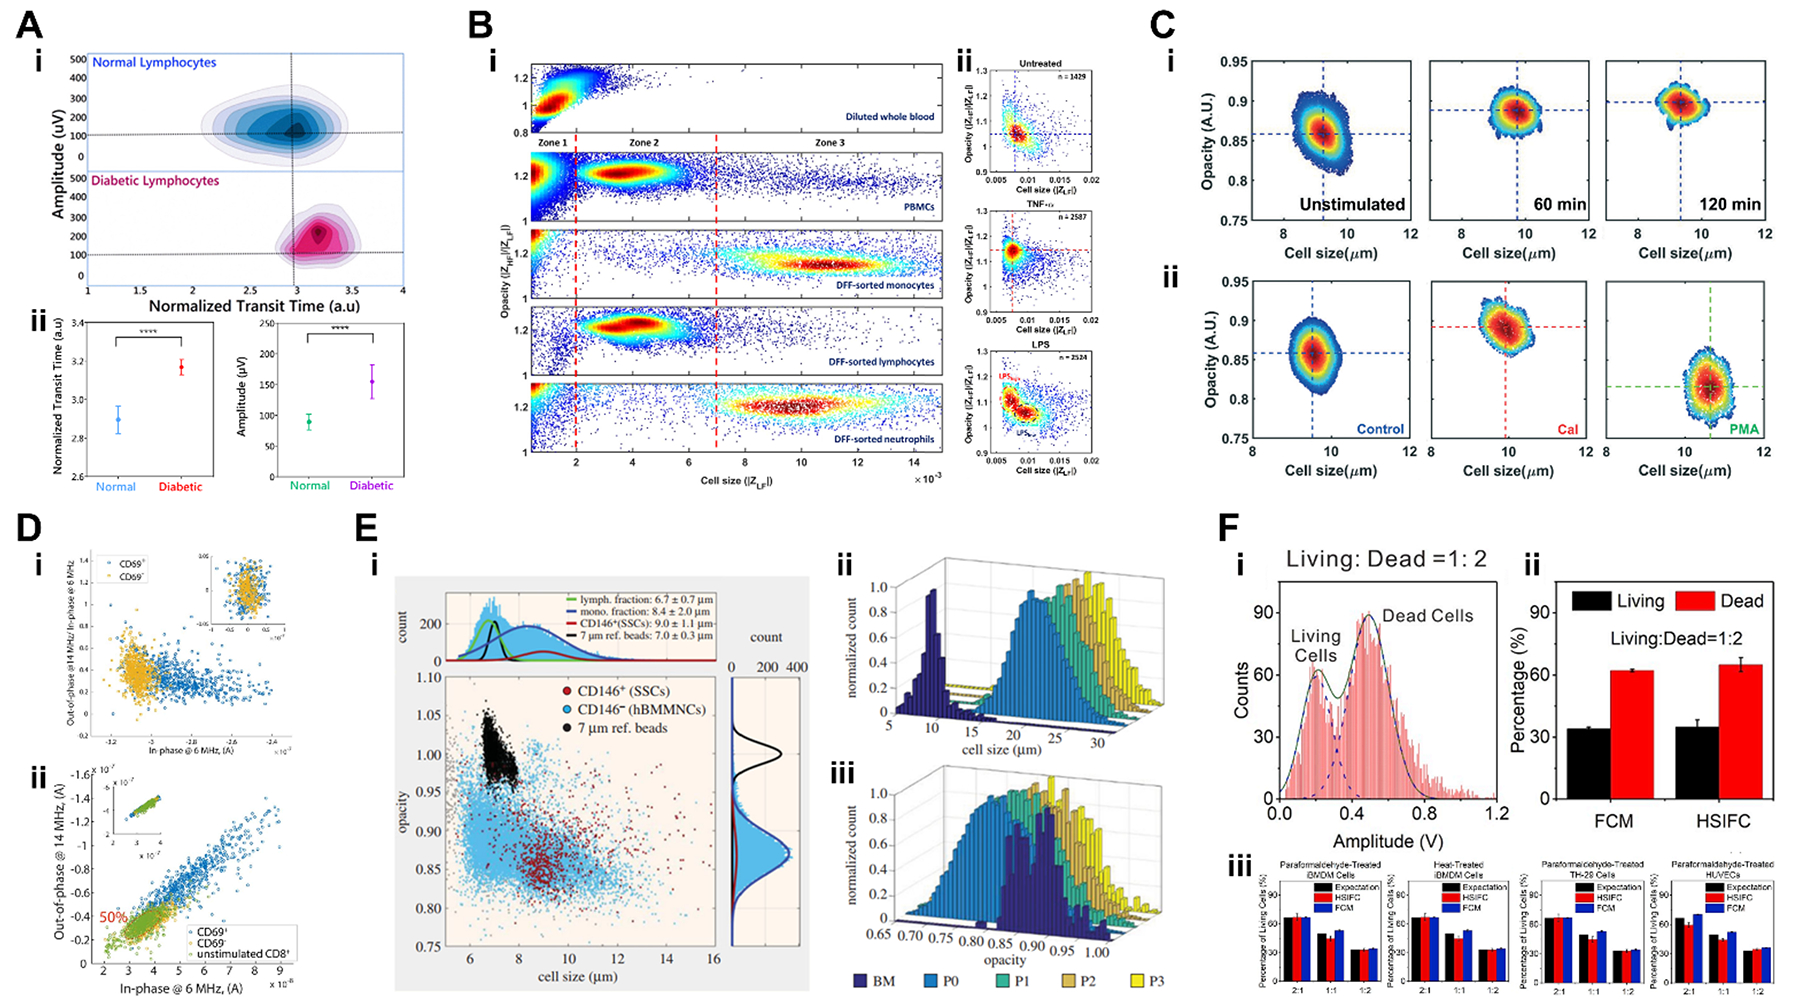
Fig. 7.

Collection of phenotyping results on mammalian cells from literature. See Sections 4.4 for further details. (A) i – Measurements of transit time vs signal amplitude for normal and diabetic lymphocytes; ii – comparison of transit time (left) and signal amplitude (right) between normal and diabetic lymphocytes, where significant differences were observed (****p < 0.0001). (B) Measurements of impedance magnitude at 300 kHz vs opacity (impedance magnitude at 1.7 MHz / 300 kHz) for various cell populations; ii - Measurements of impedance magnitude at 300 kHz vs opacity (impedance magnitude at 1.7 MHz / 300 kHz) for untreated, TNF-α and LPS treated monocytes. (C) Measurements of electrical size vs opacity (impedance magnitude at 1.7 MHz / 300 kHz) for: i – neutrophils undergoing NETosis at different time points; ii – neutrophils undergoing NETosis induced via Cal and PMA. (D) Measurements of in-phase vs out-of-phase signals at 6 MHz (i) and 14 MHz (ii) for CD69+ and CD69− T-lymphocytes (i) and unstimulated CD8+, CD69+ and CD69− T-lymphocytes (ii). (E) i – Measurements of electrical size vs opacity (impedance magnitude at 2 MHz / 500 kHz) for CD146+ and CD146− hBMMNCs; and distributions of electrical size (ii) and opacity (ii) for SSCs along passage number for one individual patient. (F) i – Distribution of signal amplitude at 450 kHz for a population of live an dead iBMDM cells; ii – comparison between viability estimations by flow cytometry (FCM) and impedance cytometry (HSIFC); iii – comparison between viability estimations by FCM and HSIFC for various cell types and treatments. Images were adapted with permission from (A) ref. 145, copyright 2019 IOP Publishing, (B) ref. 60, copyright 2018 Elsevier B.V., (C) ref. 63 copyright 2019 The Royal Society of Chemistry, (D) ref. 79, copyright 2017 Elsevier B.V., (E) ref. 161, copyright 2017 The Royal Society, (F) ref. 119, copyright 2020 Elsevier B.V..
