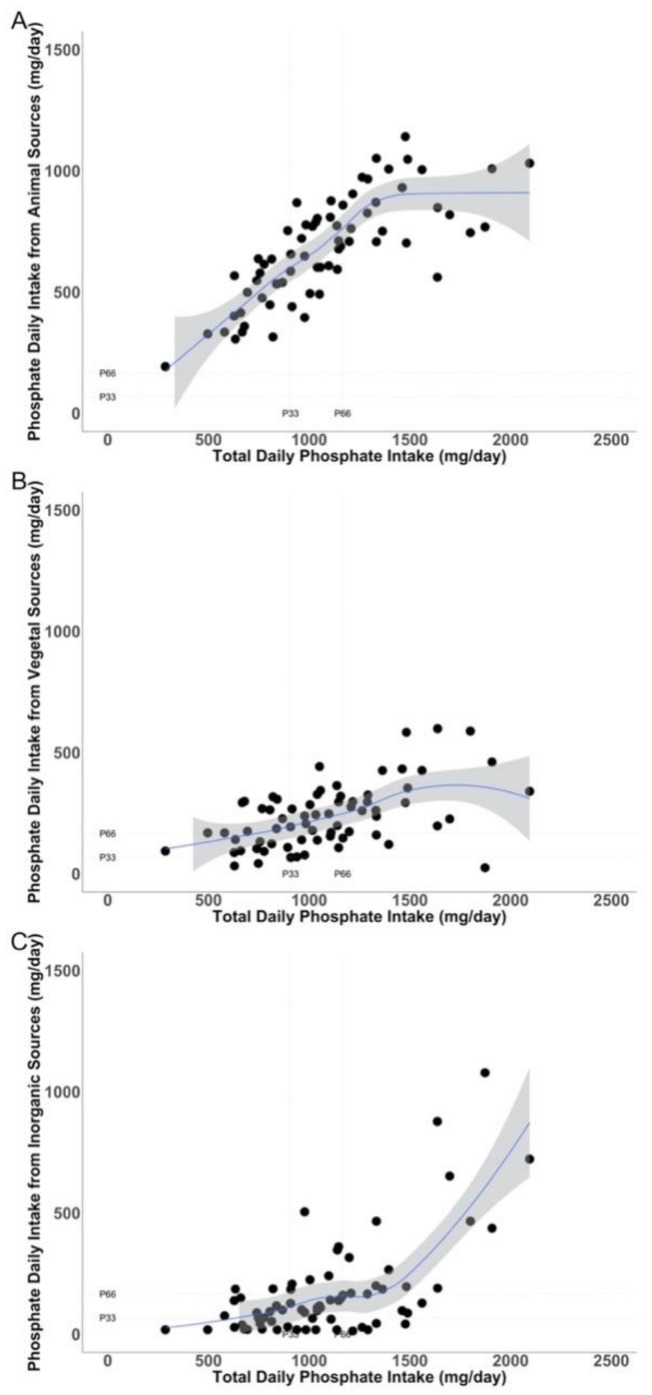
Figure 2.
Relationship between the amounts of phosphate intake (mg/day) from different sources (Y axis):animal (A), vegetal (B), and inorganic (C), and the total phosphate intake (mg/day) (X axis).Tertiles of phosphate intake and the tertiles of the different sources of phosphate are shown as dotted line in the Y and X axis. P: phosphate.

