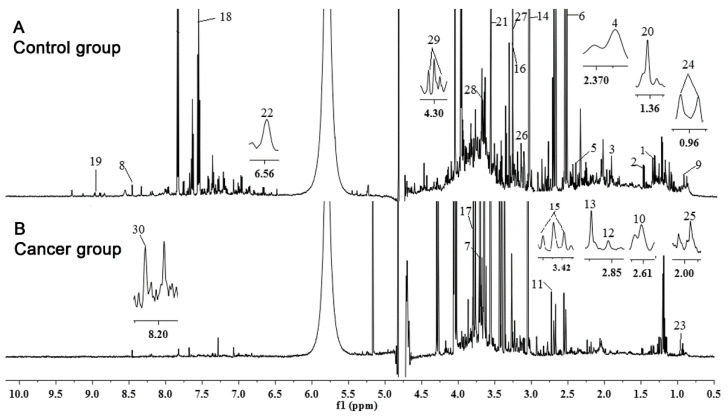
Figure 3.
Representative 600 MHz 1H-NMR spectrum and assignment of identified metabolites (digits from 1 to 30) in two representative urine samples. Signals were analyzed from δ 0.52 to 9.30 ppm, excluding water and urea regions (δ 4.32–6.10 ppm). (A) Control group; (B) Cancer group; f1 (ppm) = chemical shift to TSP.

