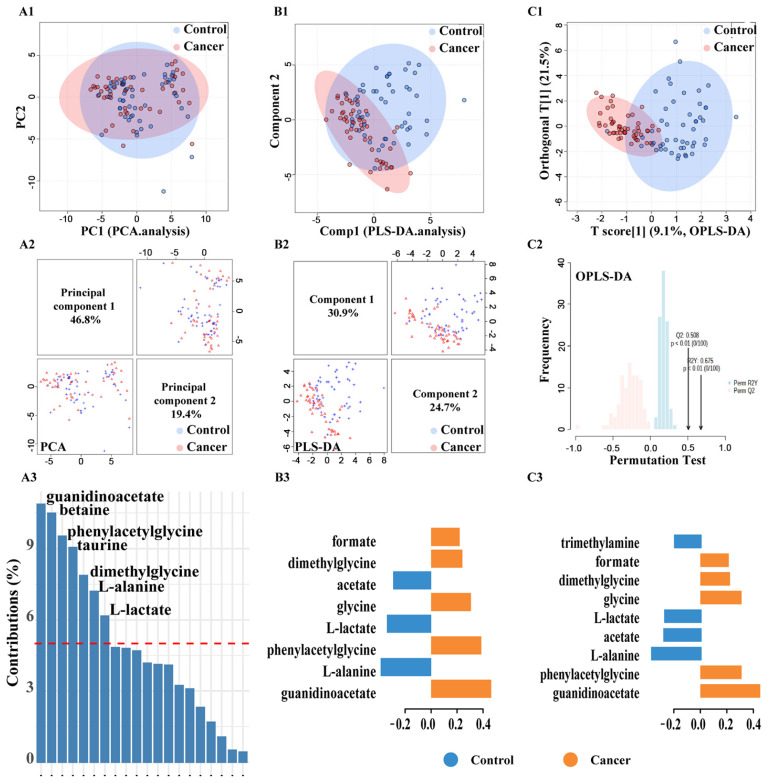
Figure 4.
Metabolic pattern recognition analysis. Classifying PC from non-cancerous men based on the metabolomic profiles in the urine; (A1) PCA based on the first two principal components; (A2) sample scatterplot displays the first two components in each data set in PCA; (A3) contribution of each feature selected on the first component in PCA; (B1) PLS-DA based on the first two components; (B2) sample scatterplot display the first two components in each data set in PLS-DA; (B3) loading plot weights of each feature selected on the first component of PLS-DA; (C1) OPLS-DA based separation of the groups; (C2) internal validation of the corresponding OPLS-DA model by permutation analysis (n = 100); fraction of the variance of descriptor class response (Y) (R2Y) = 0.675 (Green bar), p-value < 0.01; fraction of the variance predicted (cross-validated)(Q2) = 0.508 (Red bar), p-value < 0.01; (C3) loading plot weights of each feature selected from OPLS-DA; The color in B3 and C3 indicates the class in which the variable has the maximum level of expression; control = blue; cancer = orange.

