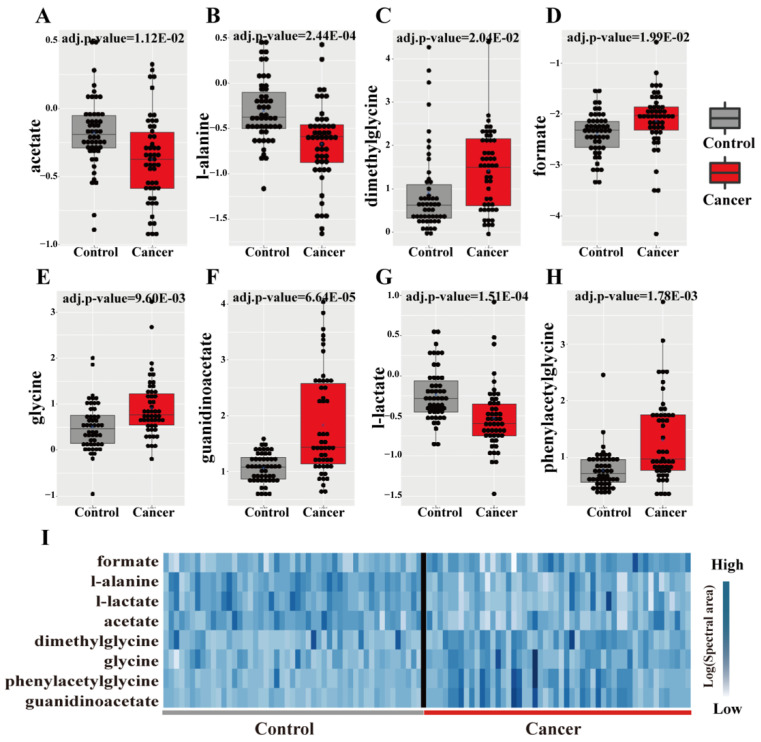
Figure 5.
Wilcoxon test results and hierarchical clustering of the metabolites. (A–H) Box plots of levels of significant metabolites based on Wilcoxon test; (I) hierarchical clustering of the significant metabolites; the samples on the left of the black bar are non-cancerous samples (control group, n = 50); the samples on the right of the black bar are PC samples (n = 50); values in the heatmap = Log (Spectral area); p-values were Bonferroni-adjusted.

