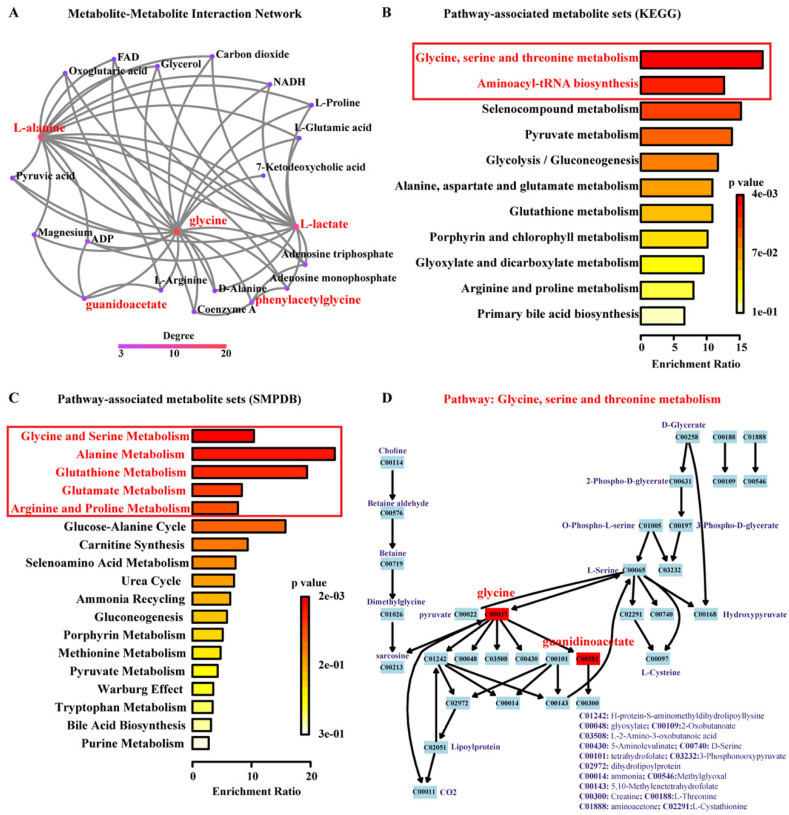
Figure 7.
Interaction network analysis and pathways associated with the five identified metabolites. (A) Interaction map of the annotated metabolites; nodes are color coded for the degree of the metabolite interactions; (B) pathways associated with the most prominent metabolites based on KEGG analysis; (C) pathways associated with the most prominent metabolites based on SMPDB analysis; (D) detailed view of the “Glycine, serine and threonine metabolism” (KEGG map00260) as the most significant pathway according to the KEGG analysis; the numbers in the boxes represent the IDs of annotated metabolites in KEGG database; prominent metabolites as a result of the current analysis are marked in red. Key signaling pathways with p-values < 0.05 were marked in boxes with red font in (B,C).

