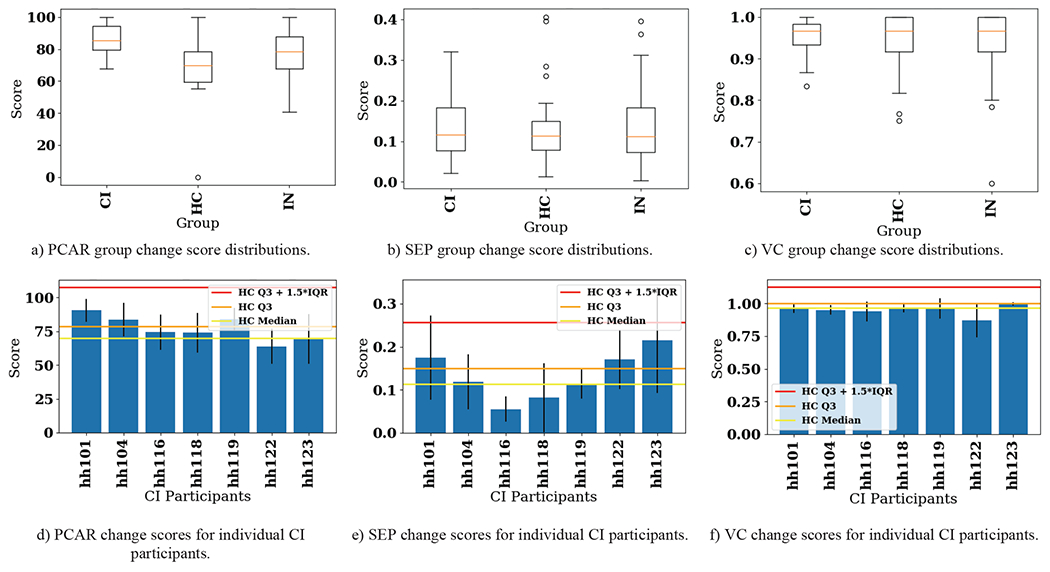
Fig. 4.

CIΔHC pairwise change score results for PCAR, SEP, and VC. Top: Distribution of change scores shown as box plots. Bottom: Pairwise changes for each participant in the CI group shown as bar plots. Bars show mean pairwise change scores while error lines on the bars show +/− one standard deviation of pairwise change scores within the CI group. Three different values of the control group scores (using only HC participants) are shown to provide context for significant changes. CI = cognitive impairment group, HC = healthy control group, IN = intergroup, Q3 = third quartile (75th percentile), IQR = interquartile range.
