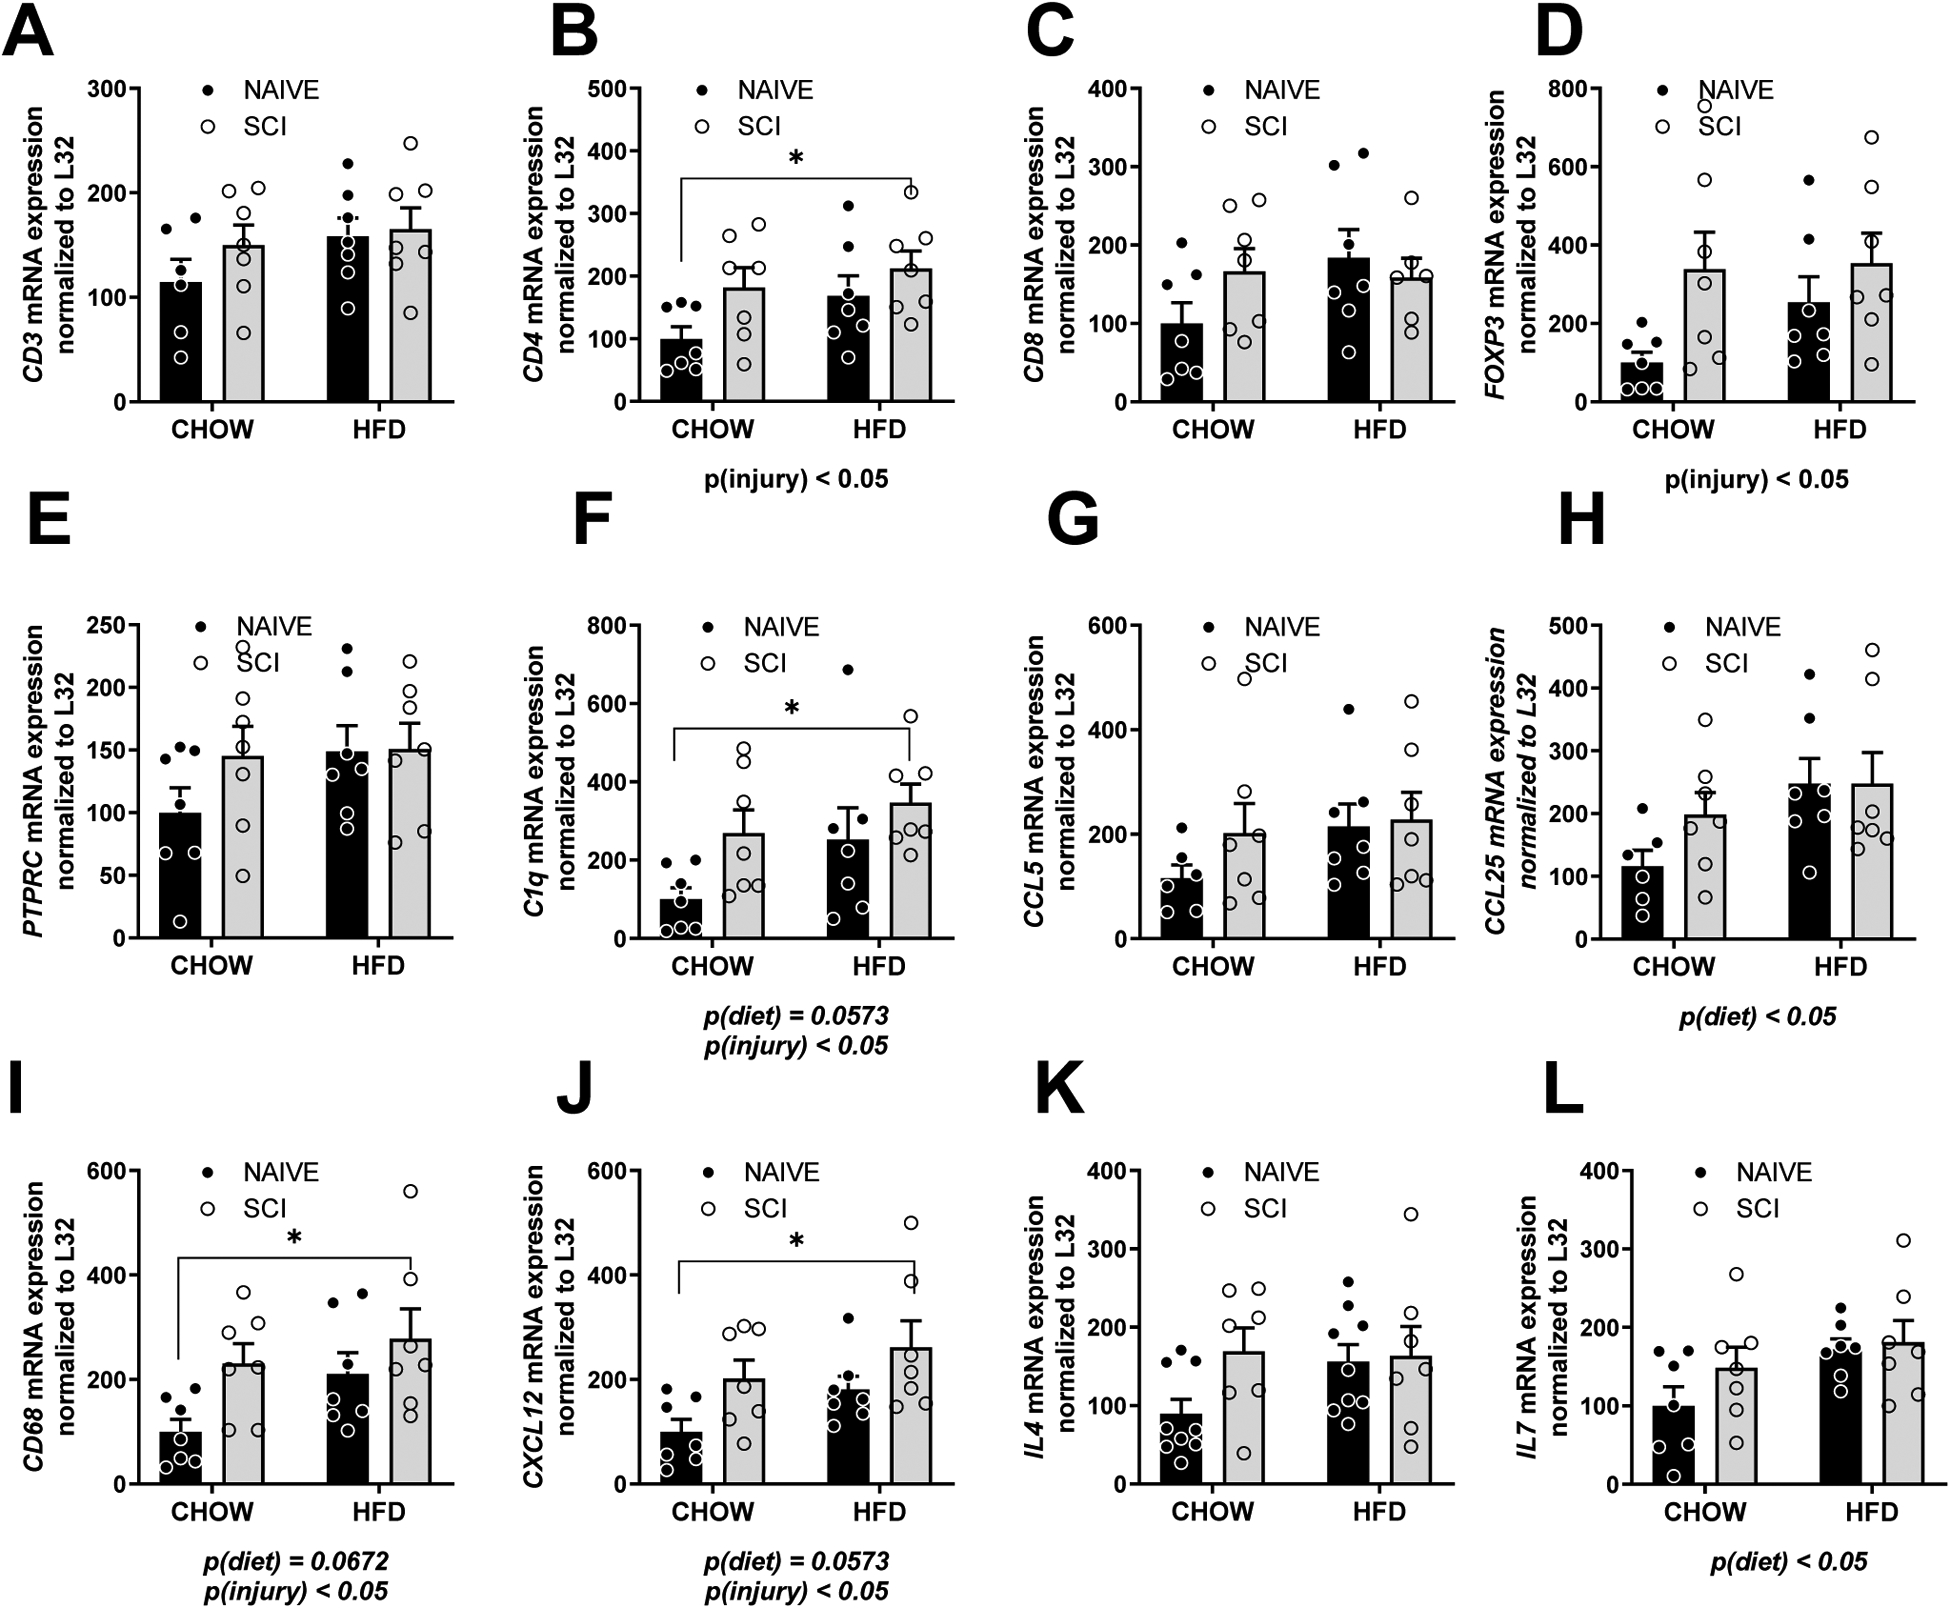
Figure 2. Gene expression by rtPCR in the thymus of Naïve/Chow, Naïve/HFD, SCI/Chow and SCI HFD normalized to ribosomal gene L32.

(A) CD3. (B) CD4. (C) CD8. (D) FOXP3. (E) PTPRC. (F) C1Q. (G) CCL5. (H) CCL25. (I) CD68. (J) CXCL12. (K) IL4. (L) IL7. (M). Data are presented as mean ± SEM. Statistical comparison of injury and diet performed by two-way ANOVA reported below each graph with post hoc Tukey’s. Relevant statistical comparison reported by *p < 0.05, ** p< 0.01, (N=6–7/group).
