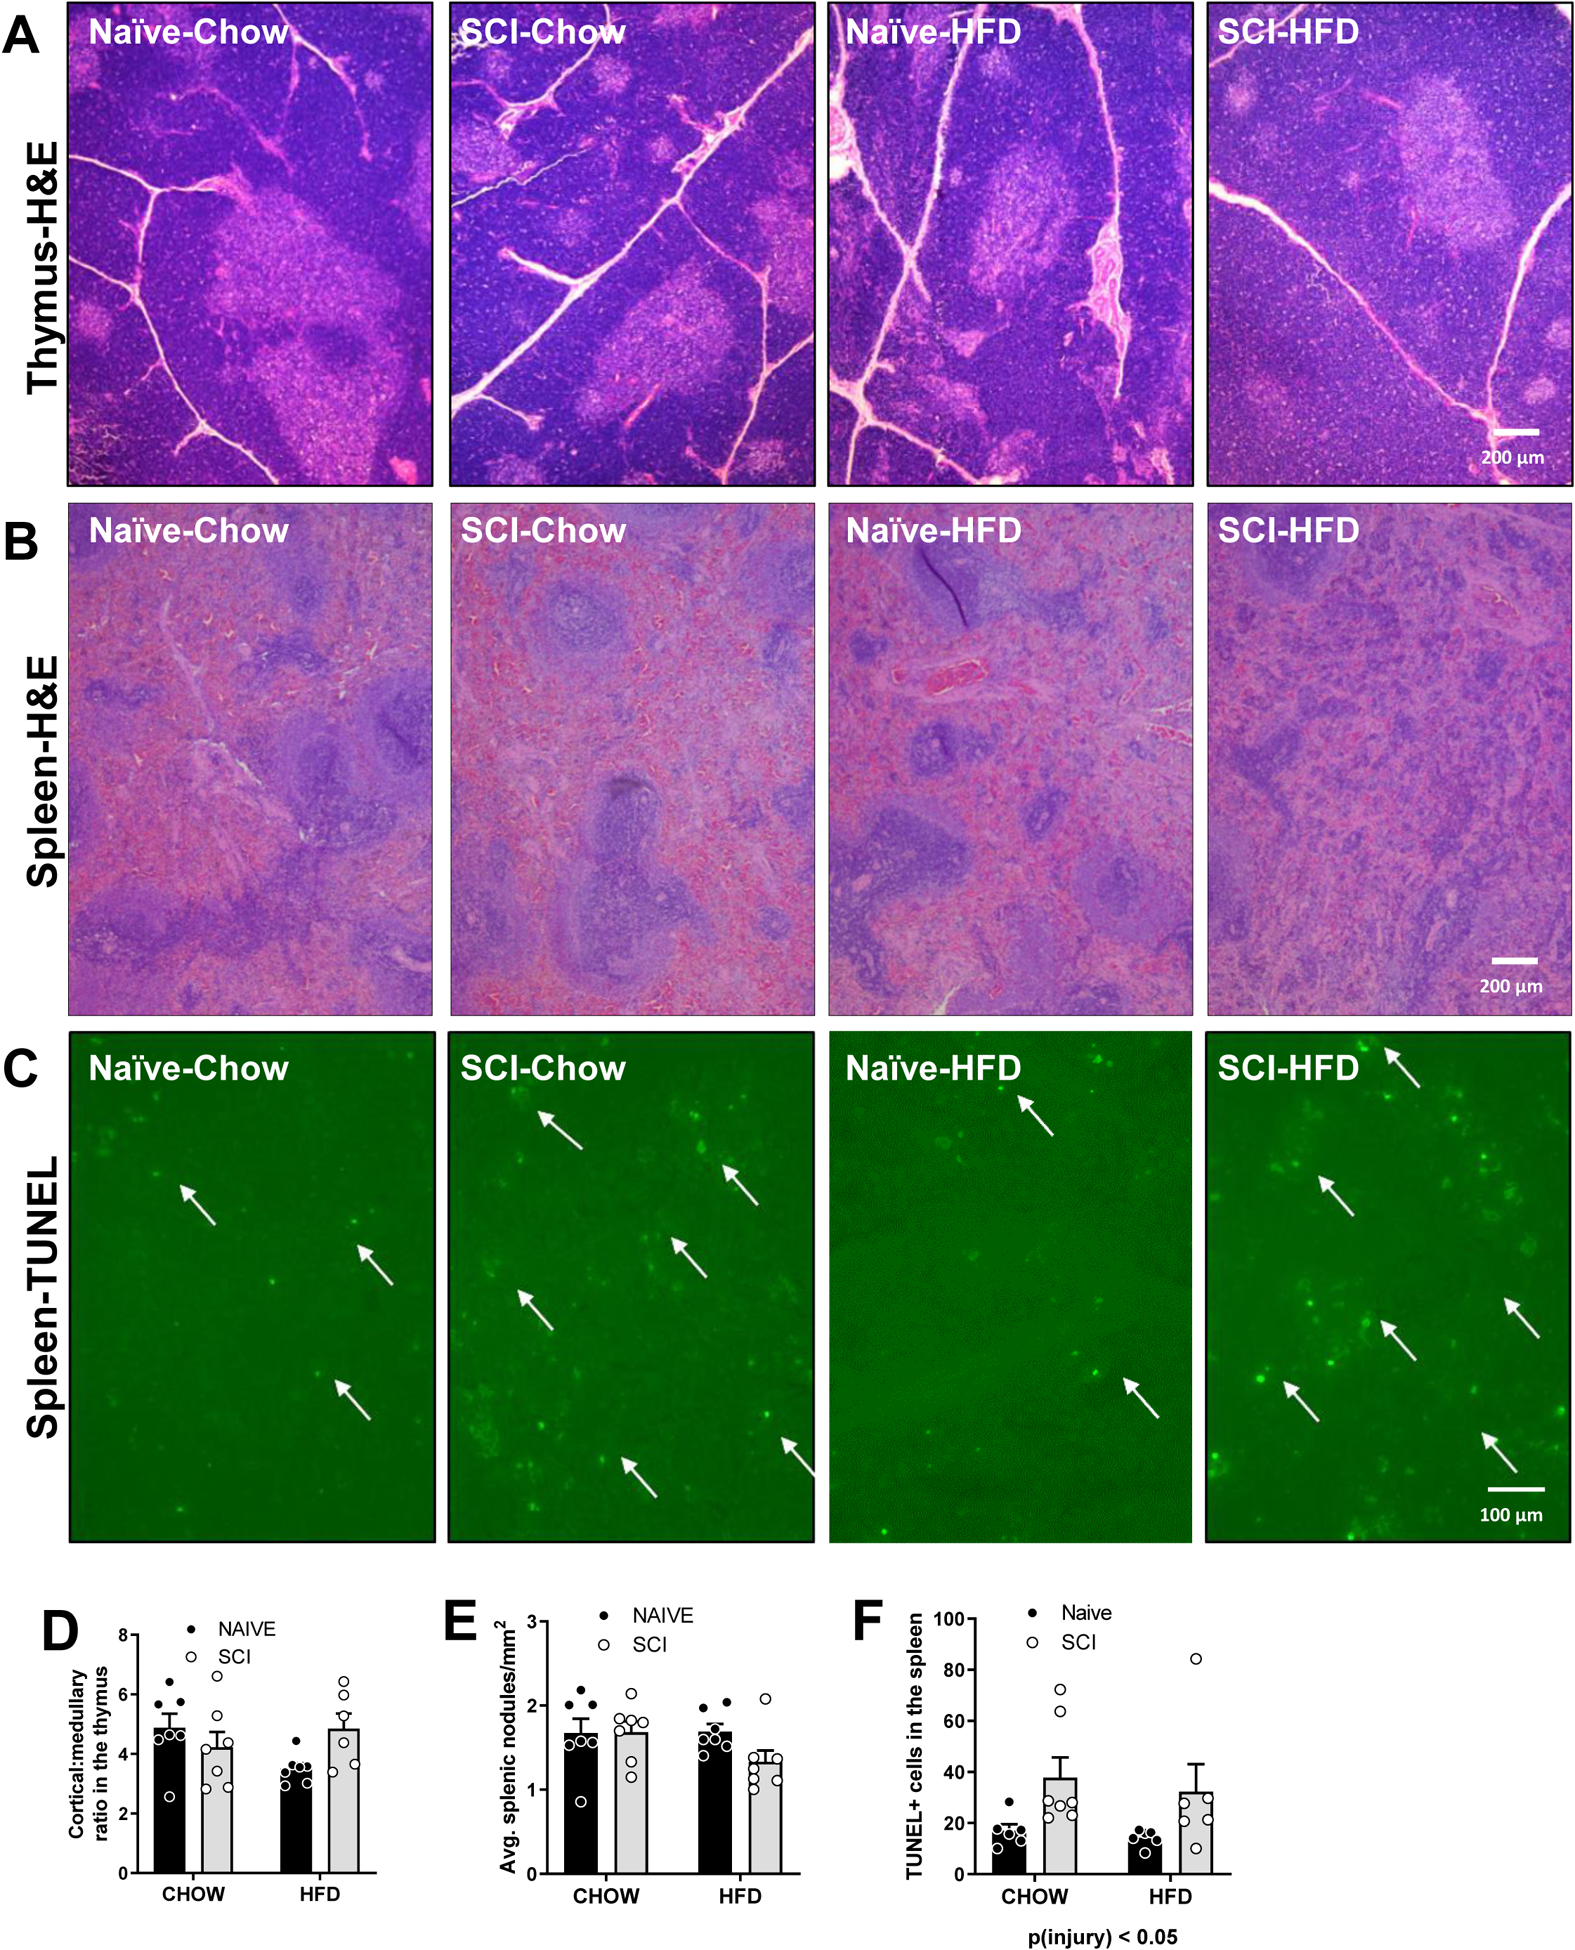
Figure 4. Histology of immune tissues of Naïve/Chow, Naïve/HFD, SCI/Chow and SCI HFD spleen 16 weeks after time of initial injury.

(A) Representative thymus H&E histology (B) Representative spleen histology. (C) Fluorescent TUNEL staining in the spleen. (D) Thymus cortex: medulla ratio. (E) Average number of nodules/mm2 (F) TUNEL+ cells in spleen. Data are presented as mean ± SEM. Statistical comparison of injury and diet performed by two-way ANOVA reported below each graph with post hoc Tukey’s. Relevant statistical comparison reported by *p < 0.05, (N=6–7/group).
