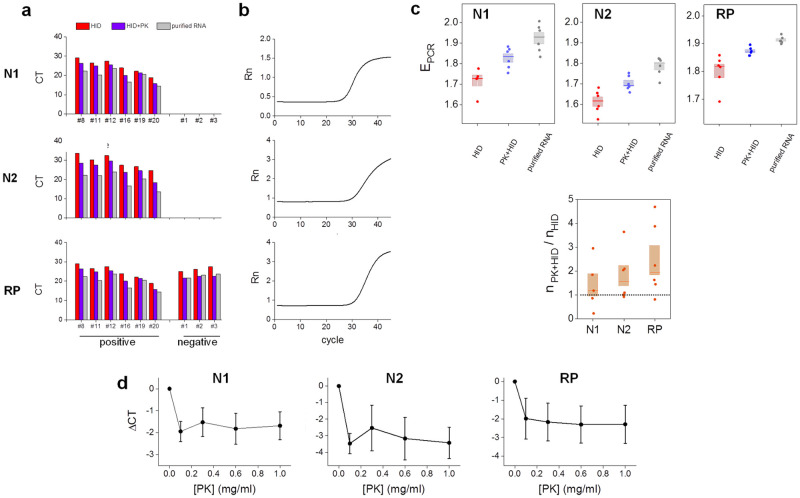
Fig 1. Proteinase K improves the performance of the heat inactivation method in RT-qPCR determinations of SARS-CoV-2.
(a-b) Positive (#8, #11, #12, #16, #19, #20) and negative (#1, #2, #3) nasopharyngeal swab samples were processed by heat inactivation (HID, 98°C for 5 min); proteinase K treatment followed by heat inactivation (PK+HID, 55°C for 15 min and 98°C for 5 min) or subjected to RNA extraction (purified RNA). The viral N1 and N2 genes and the human RNase P gene (RP) were amplified and detected by RT-qPCR. (a) CT values obtained from RT-qPCR analysis of the same samples prepared by the three different methods. (b) Representative amplification curves for each gene obtained for one of the positive samples. (c) Amplification efficiencies (EPCR) and initial amount of amplicon copies (n) in PK+HID samples relative to the corresponding HID samples. The median of each measurement is represented with a line in the bars and the lengths of these bars represent the standard error. (d) Positive nasopharyngeal swab samples were subjected to treatment with different concentrations of proteinase K (PK) followed by heat inactivation (55°C for 15 min and 98°C for 5 min). The viral N1 and N2 genes and the human RP gene were amplified and detected by RT-qPCR. ΔCT represents the mean difference between CT values obtained in each analyzed condition and the corresponding to HID samples. Mean ± SEM values are represented (N = 5).

