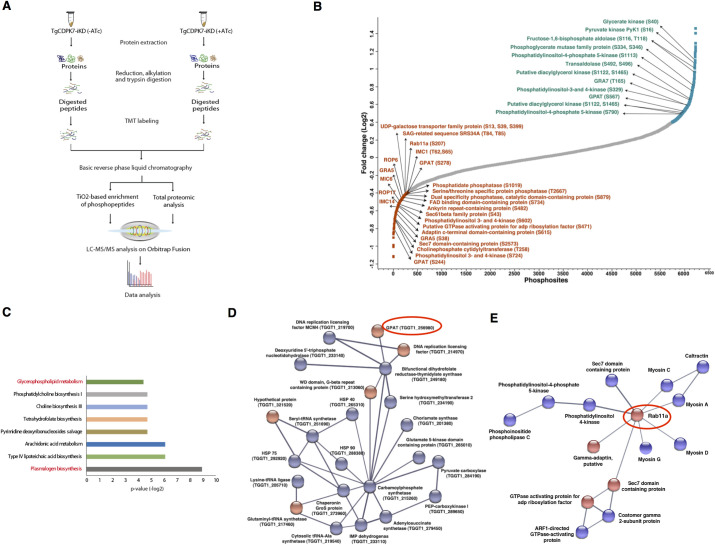
Fig 2. Comparative phosphoproteomics of TgCDPK7-iKD parasites.
A. Schematic representation of the overall workflow employed for comparative proteomic and phosphoproteomic analysis. A TMT-labeling approach was used for TgCDPK7-iKD parasites (for details see Materials and Methods S1 Data 1.1). B. The phosphorylation fold-change ratios of phosphopeptides identified from TgCDPK7-iKD tachyzoites cultured in the presence or absence of ATc was normalized with respect to total protein fold-change. The ratios for all phosphopeptides from various replicates are provided in S1 Data, 1.1. The S-curve for normalized data is provided and some of the significantly altered phosphorylation sites belonging to key proteins (S1 Data, 1.2) are indicated. Representation of phosphosites and their corresponding abundance fold change in TgCDPK7 depleted parasites. Some of the differentially phosphorylated sites are highlighted in red and blue color, respectively and key target proteins that are relevant to the reported studies are indicated in green. C. Pathway analysis of proteins that exhibited reduced phosphorylation upon TgCDPK7 depletion and the possible metabolic pathways these proteins may regulate (S1 Data, 1.4). D and E. Protein-protein interactions were predicted between differentially phosphorylated proteins using STRING resource. The analysis exhibited high confidence protein-protein interactions between the candidate genes (S10 Fig and S1 Data, 1.6). Two major protein-protein interaction clusters involving TgRab11A (D) and GPAT protein (E) are illustrated.

