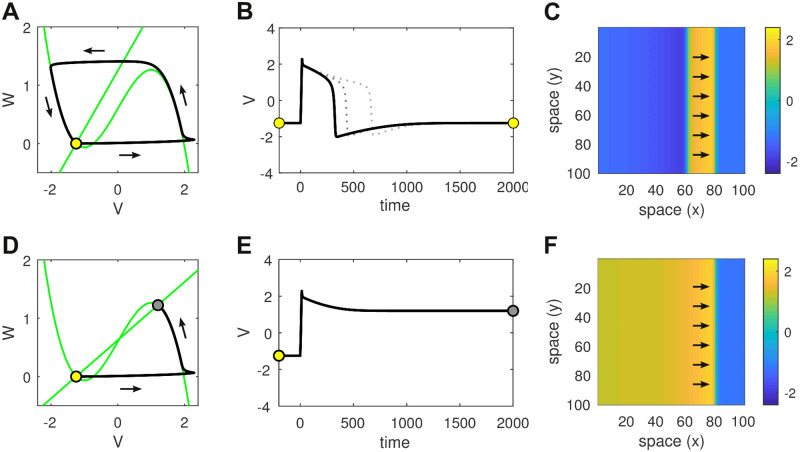
Fig 2. Comparison of monostable versus bistable dynamics in both the isolated cell and the homogeneous spatial medium.
(A) Phase plane of the isolated cell in the monostable regime (b = 1). The nullclines are shown in green. The single fixed point (open circle) is stable. It represents the resting membrane potential. The system can be perturbed from rest by a brief injection current (I = 2 for 15 ms) that initiates a trajectory (black line) which makes a large excursion in phase space before returning to rest. That excursion corresponds to the action potential. (B) Time plot of the action potential in the monostable regime. Solid line for b = 1. Dotted lines for b = 1.5 and b = 1.75. (C) Snapshot of the corresponding traveling wave in a homogeneous sheet of 100 × 100 monostable cells with coupling parameter c = 1. Arrows indicate the direction of travel. Color indicates the membrane potential. (D) Phase plane of the isolated cell in the bistable regime (b = 2). Perturbing the resting state (open circle) induces a transition to the up-state (filled circle). (E) Time plot of that transition. (F) The corresponding traveling front in the spatial medium.

