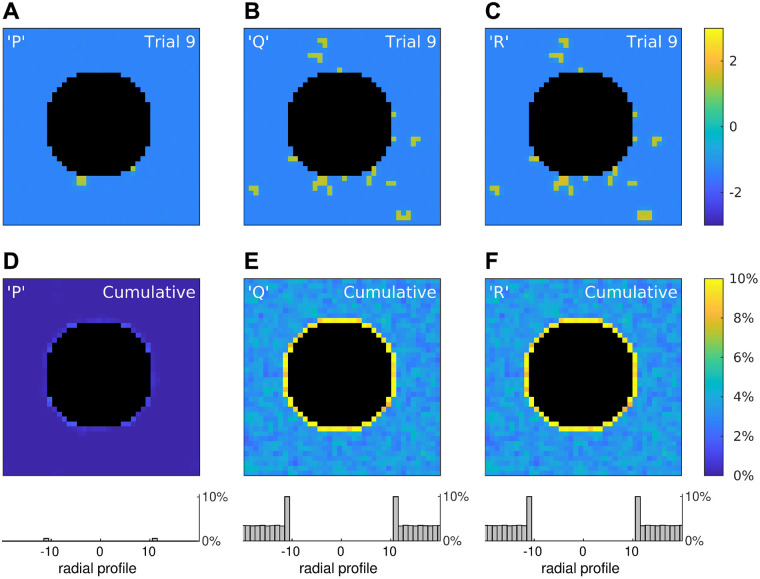
Fig 6. Rogue activity emerges preferentially at tissue boundaries.
(A–C) Snapshots of three simulations of a 40 × 40 medium in which 10% of the cells were configured to points P, Q or R in the stability map of the reduced model (Fig 5). The snapshots were taken at t = 1000 ms post-onset of a spatially uniform stimulus. The central annulus (black) represents a tissue boundary where cells are absent. The edges of the simulation domain used periodic boundary conditions to eliminate artificial boundary effects. The color scale indicates the membrane potential of the cells. (D–F) Cumulative results for 1000 trials where color is the percentage of cells that remained depolarized in the long term. Histograms (bottom) show the averaged radial profiles. See S2 Video for an animated version of this figure.

