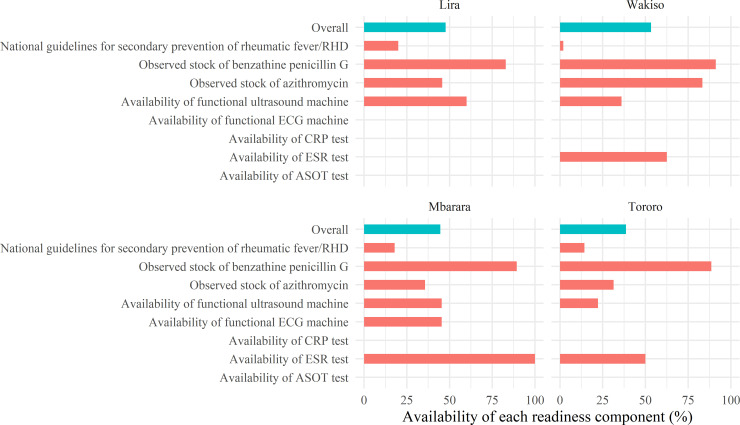
Fig 1. Secondary prevention service readiness by district.
The figure provides estimates by district of the average percent availability of each indicator used to measure secondary prevention readiness. The overall percent availability of secondary prevention, i.e., the presence of all indicators at a given facility, is shown as a blue bar.

