
Fig. 1.
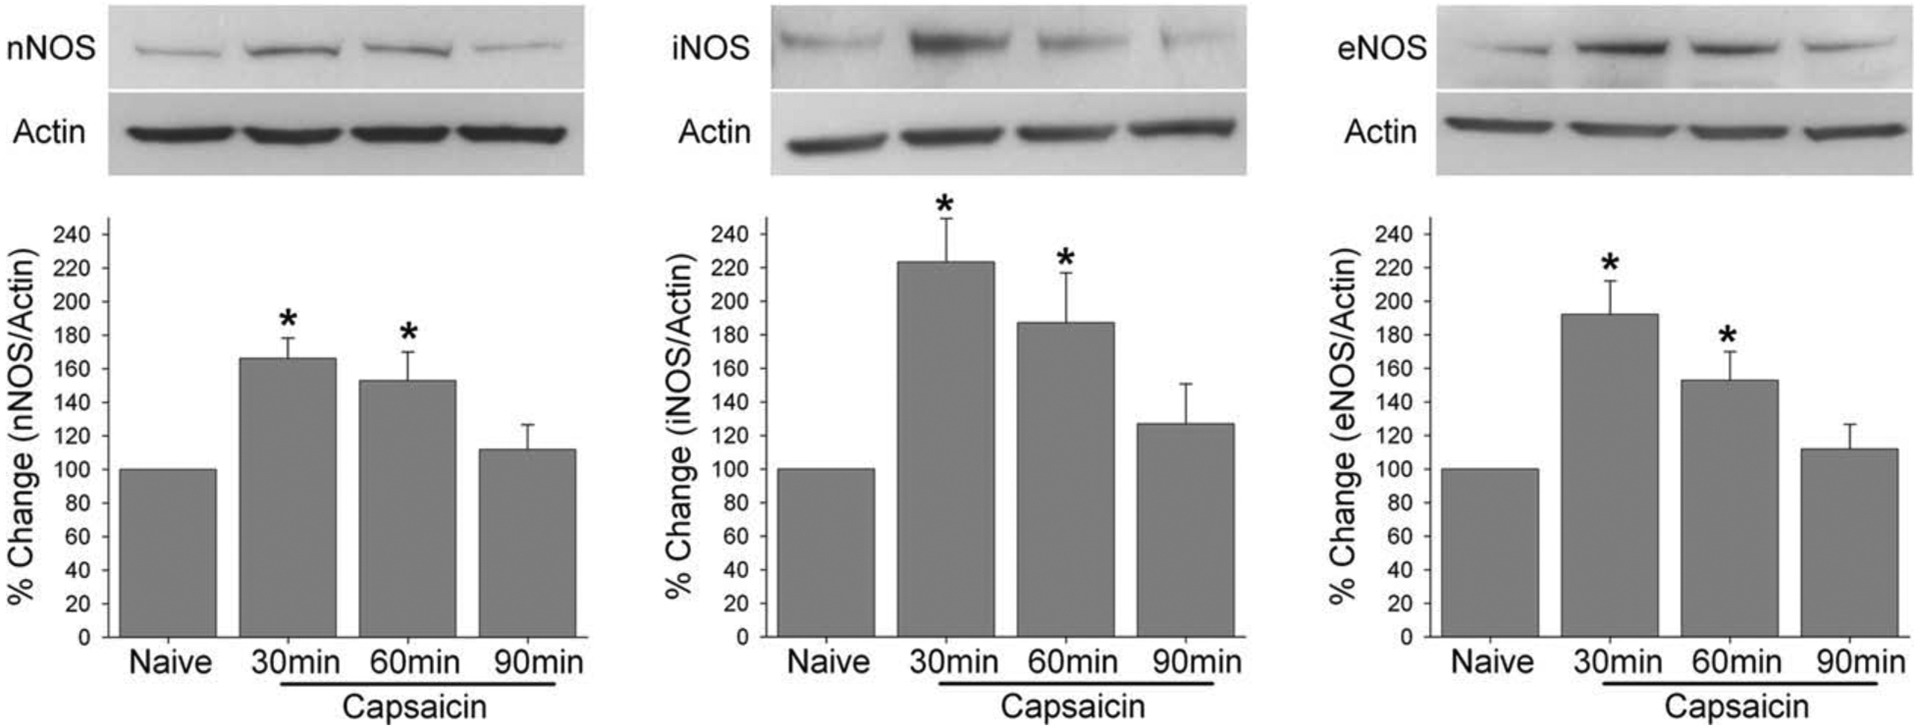
Upper panels show examples of representative blots for each NOS along with actin in lower panels. The group data are from densiometric analysis of the ratio between NOS and actin from each animal. * denotes significant difference at p = 0.05 her and all subsequent figures.