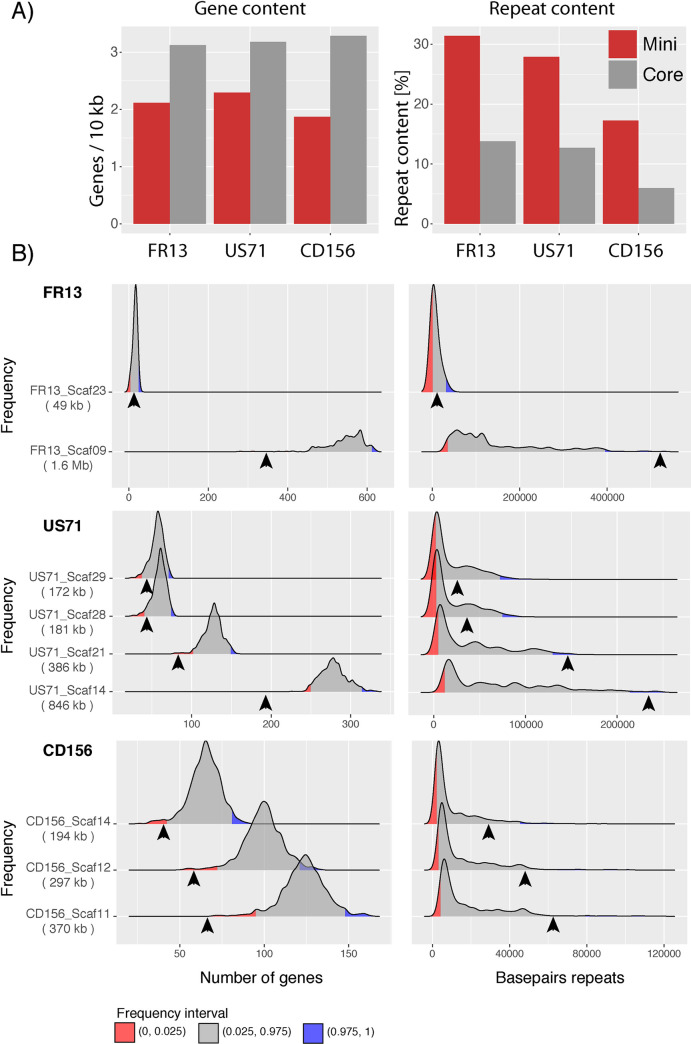
Fig 5. Mini-chromosomes have lower gene and higher repeat content than core-chromosomes.
A) Bar plots of gene and repeat content of mini- (red) and core-chromosomes (grey) of isolates FR13, US71, and CD156. B) Density plots resulting from a bootstrapping analysis of gene and repeat content of isolates FR13, US71, and CD156. 10000 core-genomic fragments were randomly sampled for each mini-chromosome scaffold and distribution of genes and basepairs of repeats are shown as densities. Number of genes and repeat content of mini-chromosome scaffolds are indicated by arrowheads. The size of mini-chromosome scaffolds is given in parentheses. Lower and upper 2.5% frequency intervals are shown in red and blue. X-axis: number of genes and basepairs of repeats. Y-axis: Frequency in 10000 fragments. Y-axis limits set to min/max.

