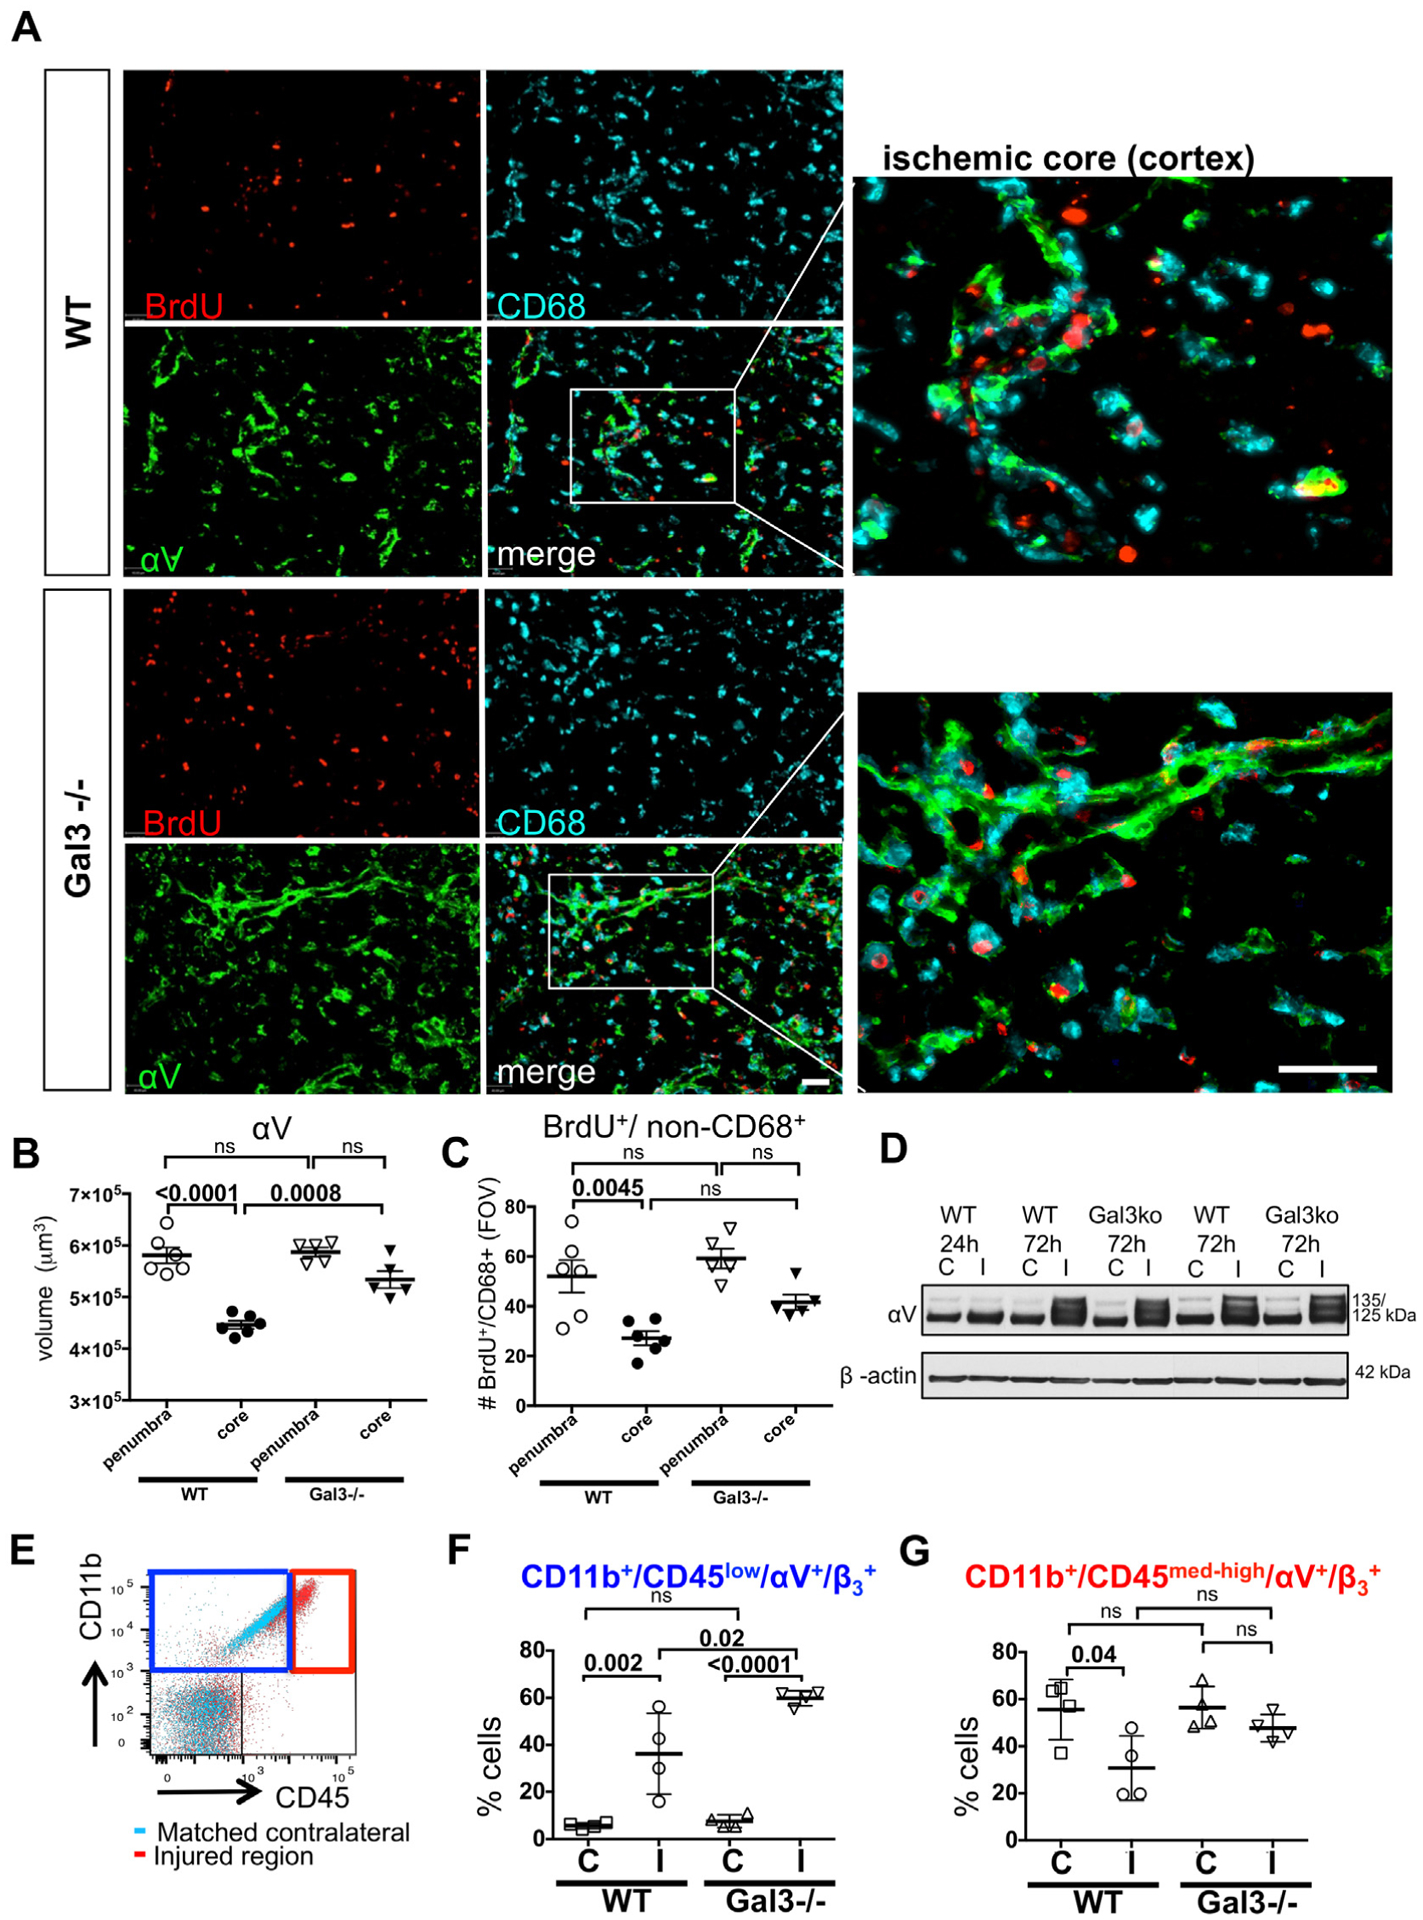
Fig. 5.

Microglia/macrophage coverage and expression of αV integrin in the penumbra and ischemic core. A. Examples of αV and CD68 expression in WT and Gal3−/− by immunofluorescence. B–C. Quantification of αV volume (B) and BrdU+/non-CD68+ cells (C) in the penumbra or ischemic core regions in the ischemic cortex or caudate (n = 6 for WT, n = 5 for Gal3−/−), Mean ± SD. Scale bar: 40 μm. FOV = 2.9 × 106 μm3. D. Representative example of Western blot of αV and β-actin expressed in WT and Gal3−/− at 24 h and 72 h post-MCAO. E. Overlay of dotplots of contralateral (aqua) and injured (red) regions. αV and β3 were gated from CD11b+/CD45low (blue square; left upper quadrant) or CD11b+/CD45med-high (red square; right upper quadrant). F. cell population in WT and Gal3−/− at 72 h post-MCAO. F–G. cells were gated from CD11b+/CD45low (in blue) or CD11b+/CD45med-high (in red) (n = 4 for WT, n = 4 for Gal3−/−). Dots in B, C, F and G represent data from individual animals. Results are shown as Mean ± SD. Significance levels are denoted by P values based on ANOVA with Bonferroni post hoc test. ns: non-significant. (C) – contralateral, (I) – injured.
