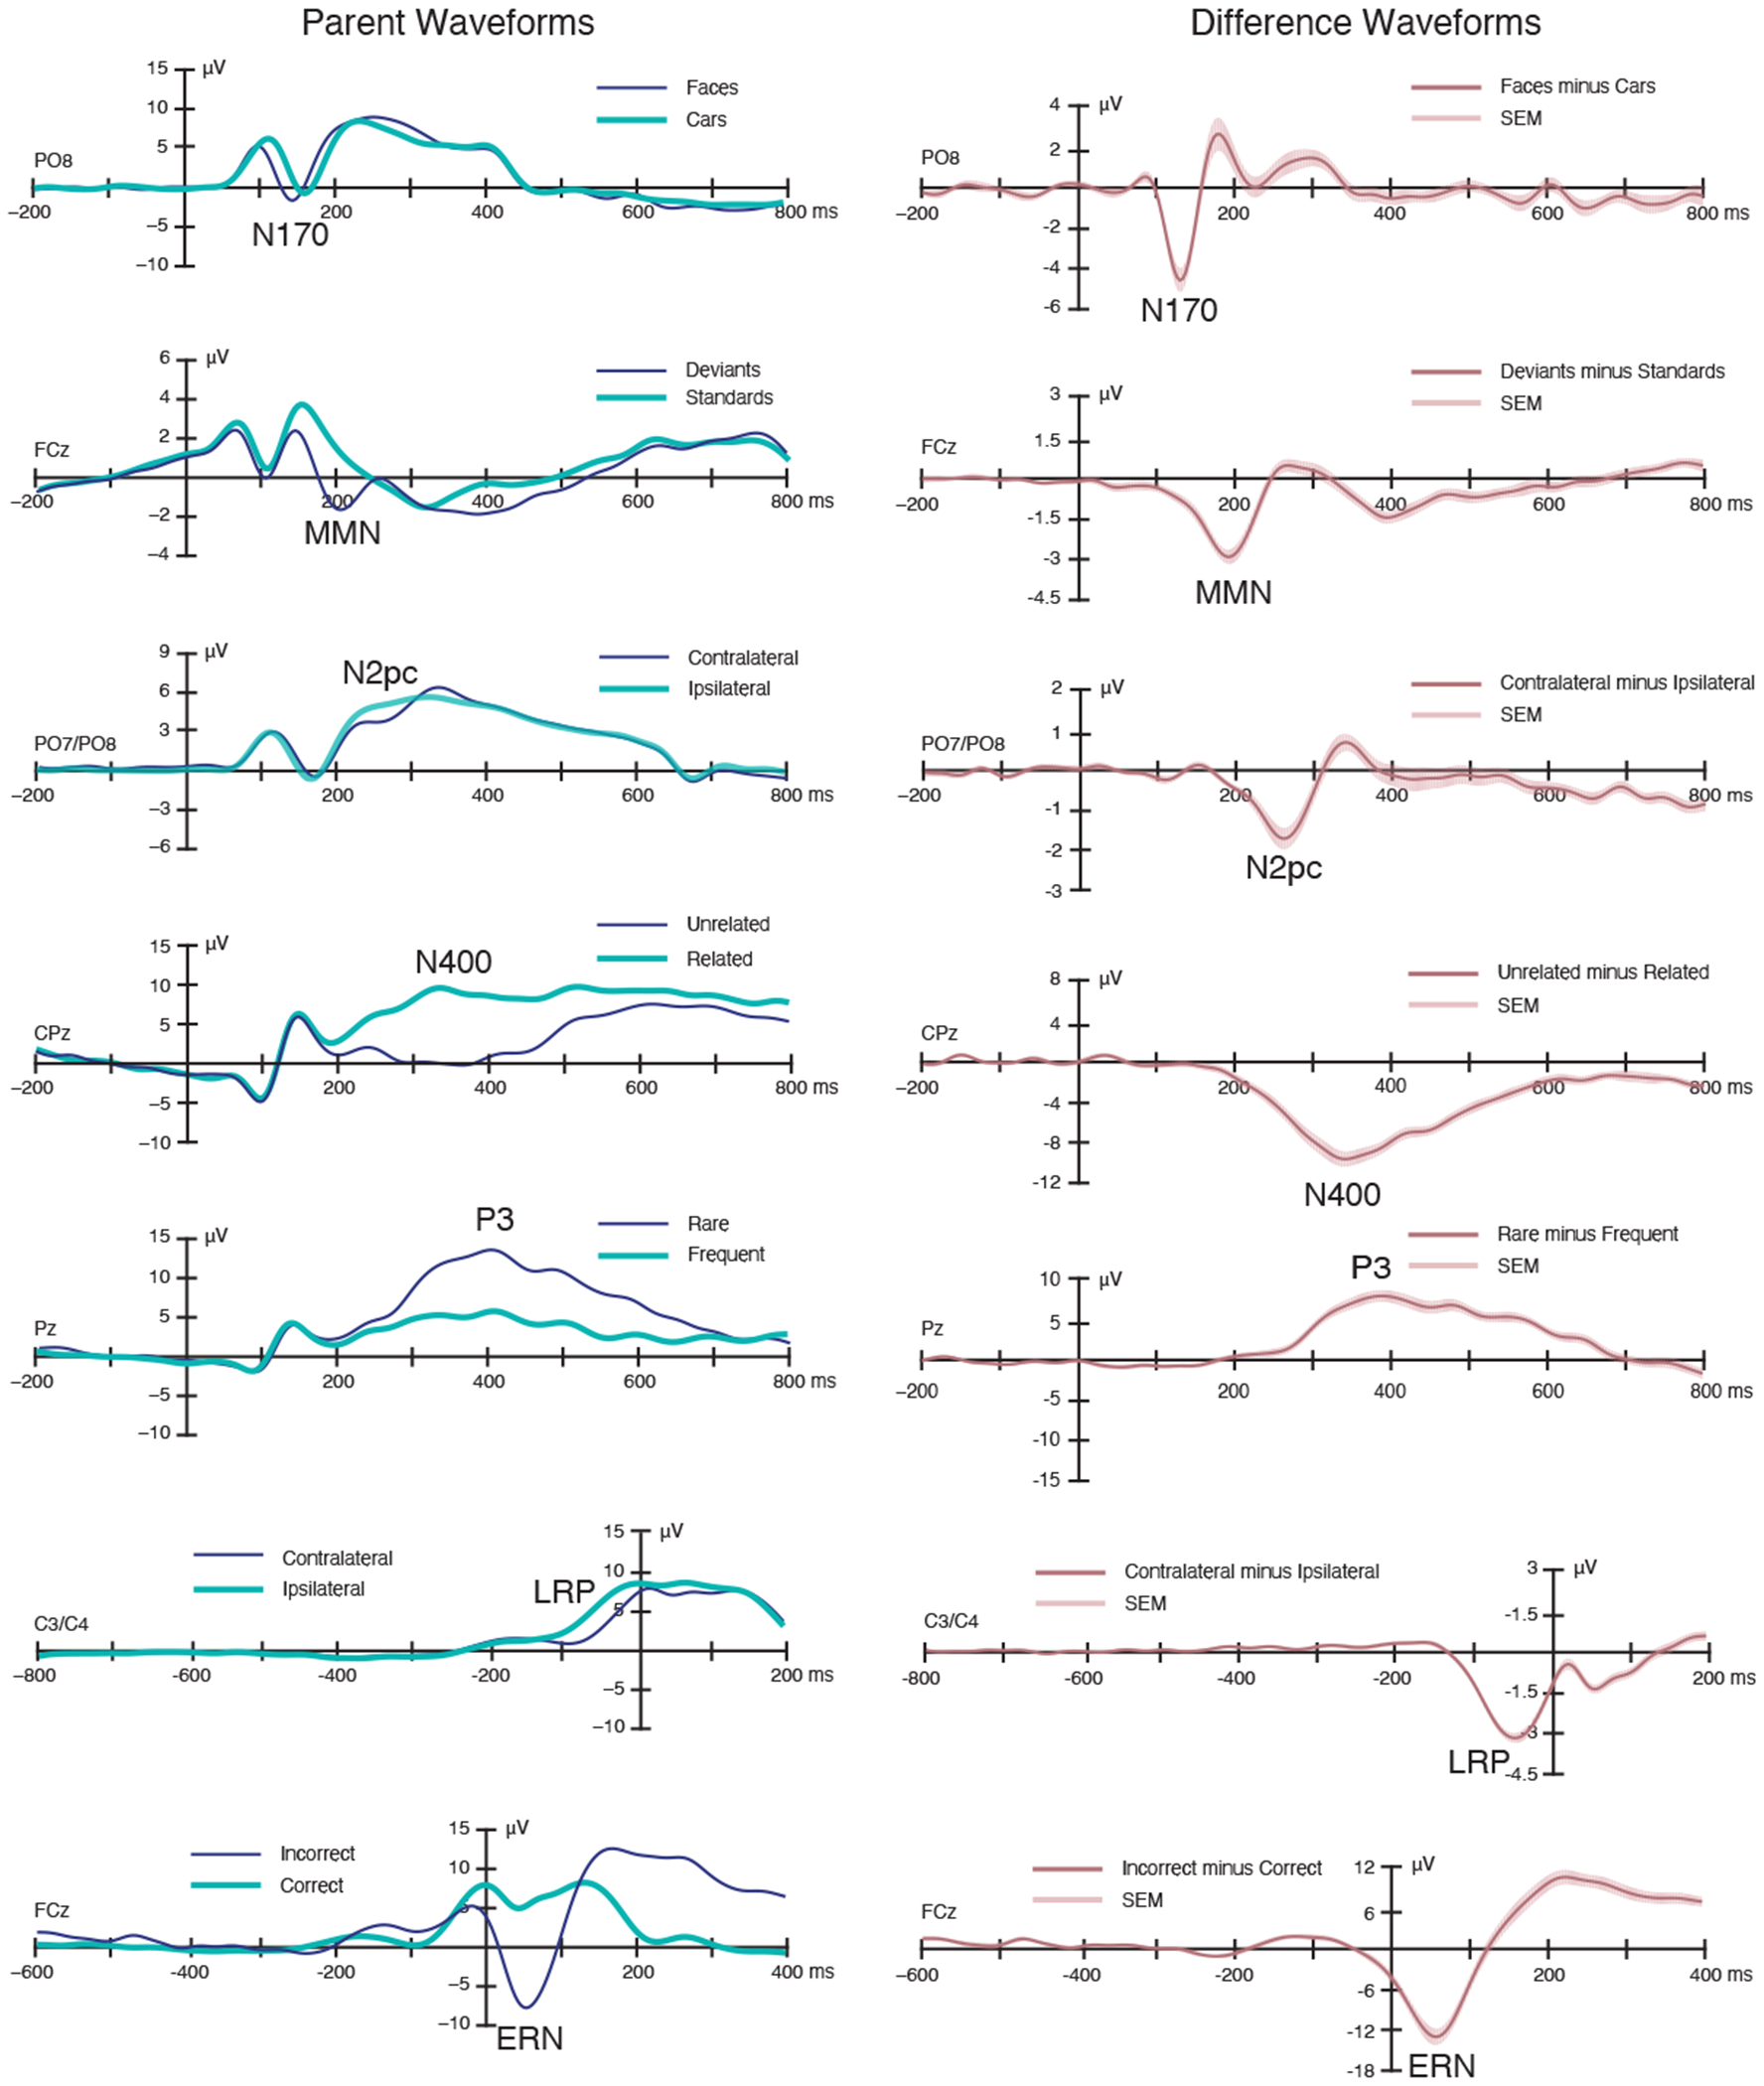
Figure 2.

Grand average parent ERP waveforms (left) and difference waveforms (right). The shading surrounding the difference waveforms indicates the region that fell within ±1 SEM at a given time point (which reflects both measurement error and true differences among participants). A digital low-pass filter was applied offline before plotting the ERP waveforms (Butterworth impulse response function, half-amplitude cutoff at 20 Hz, 48 dB/oct roll-off).
