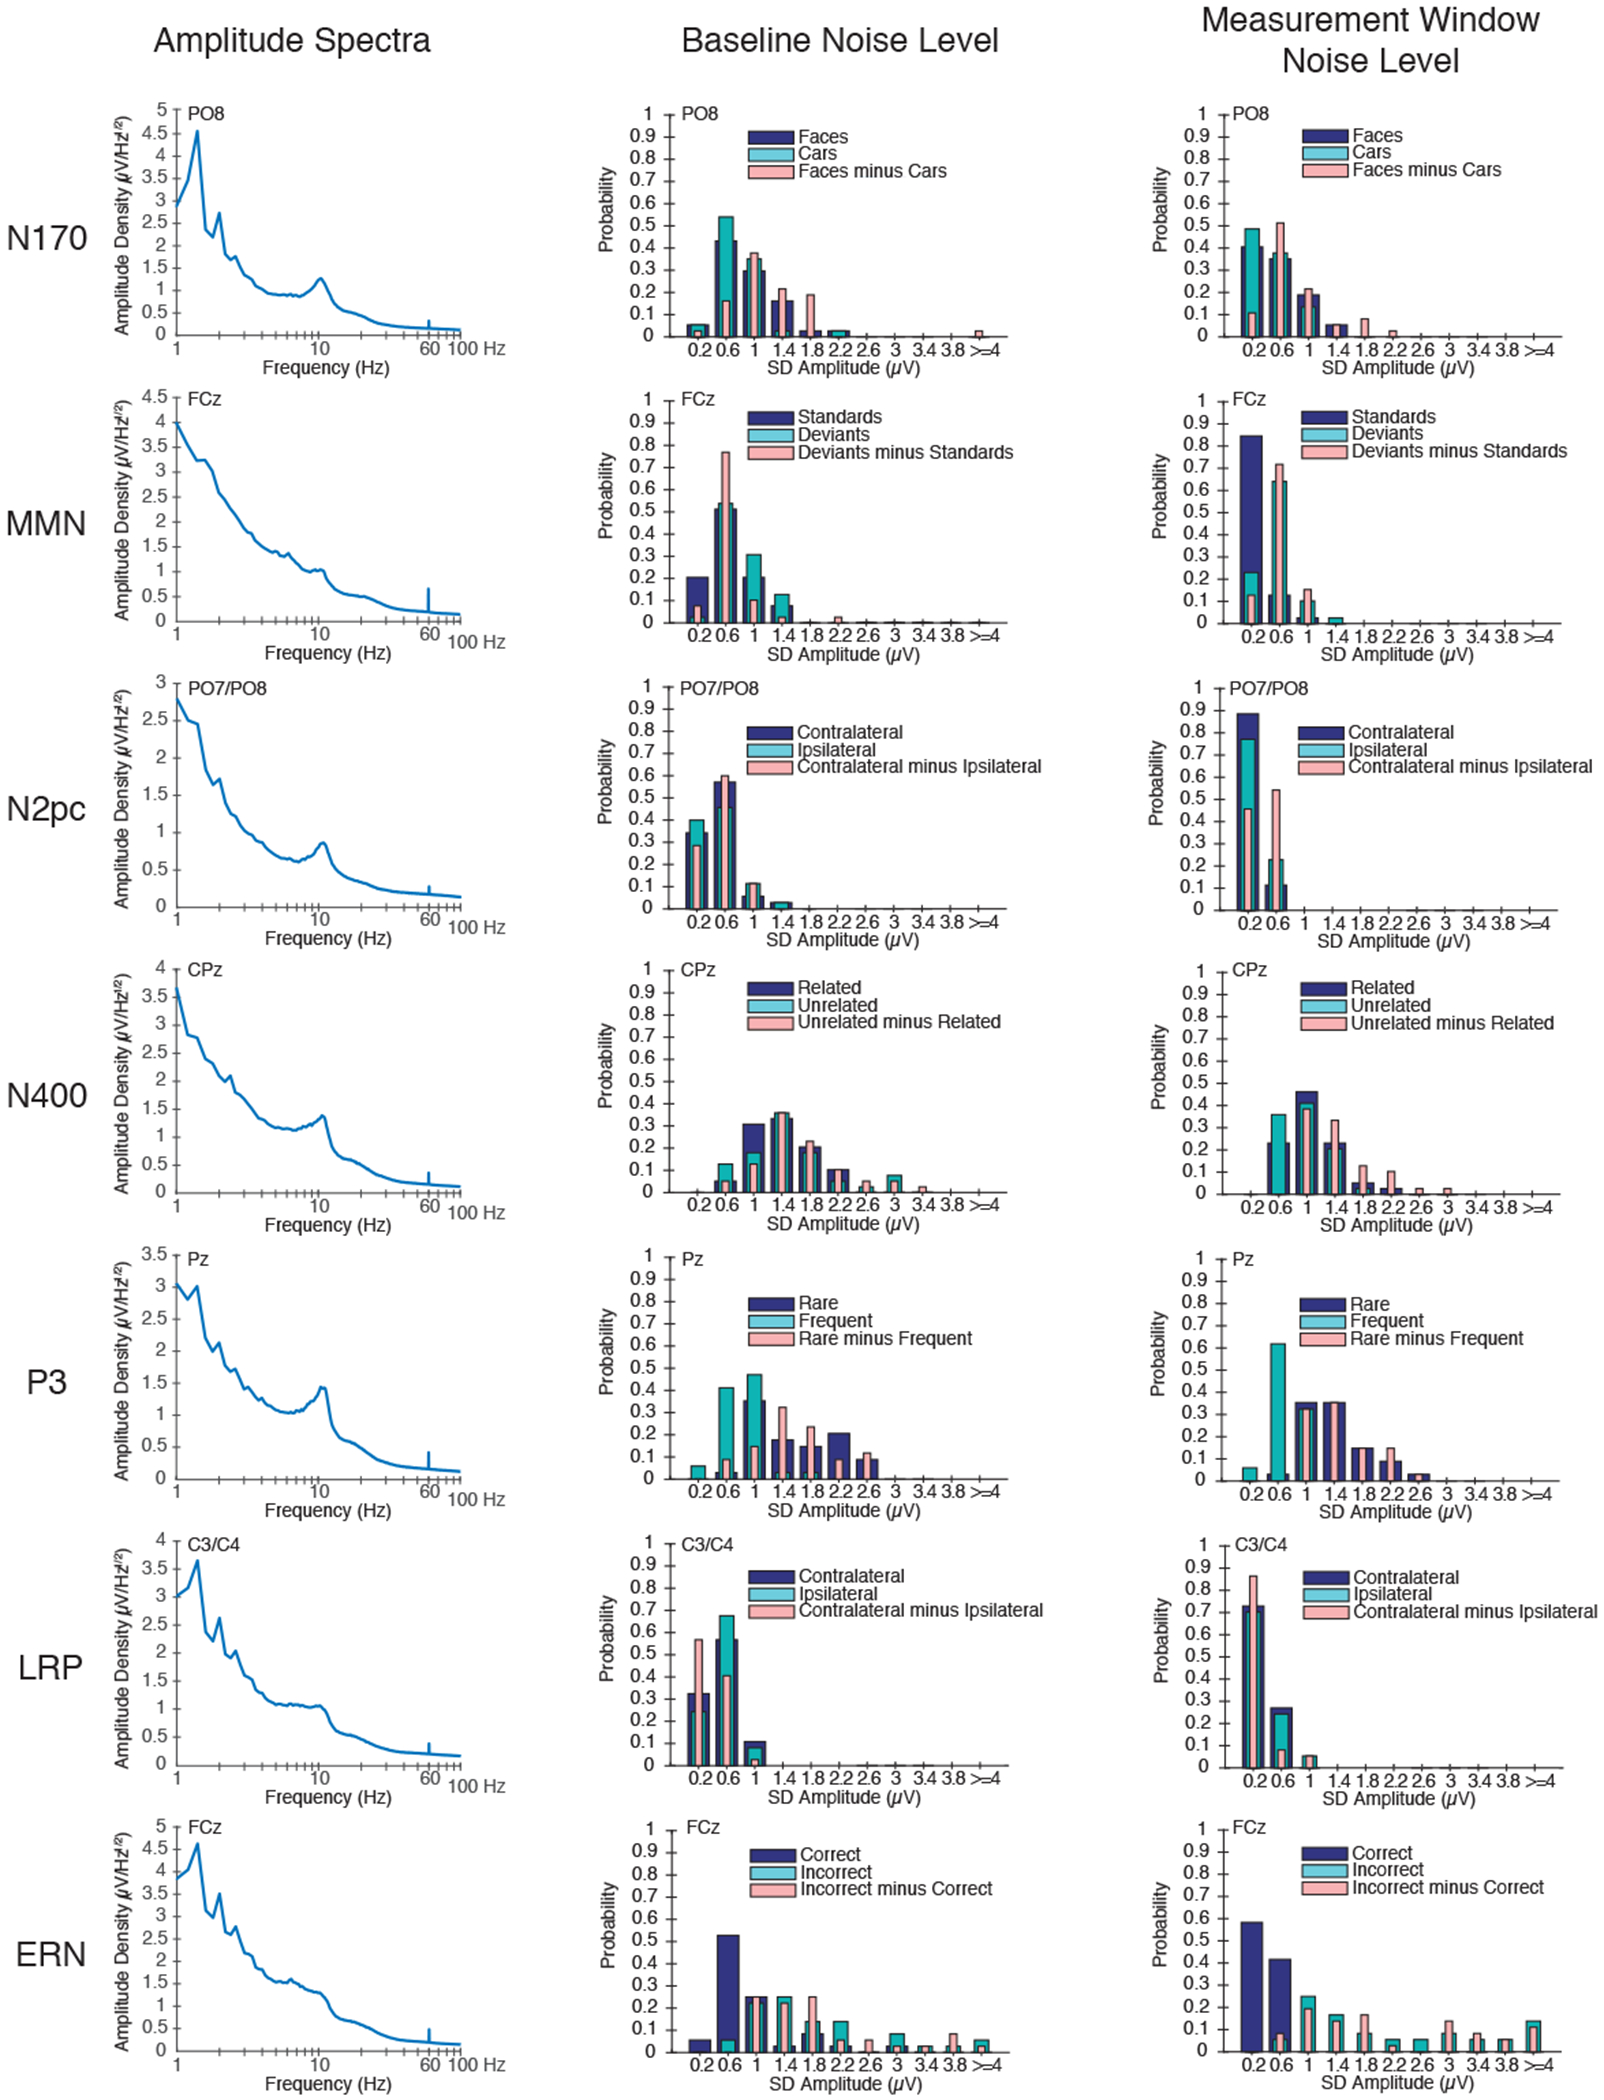
Figure 3.

Quantification of the EEG signal and the ERP noise. (Left) Amplitude density as a function of frequency (on a log scale) for each ERP component at the electrode site where that component was maximal, calculated from individual participants and then averaged. Note that, although LRP and ERN were isolated in the same task, the spectra were obtained at different electrode sites and therefore differ slightly. (Middle) Probability histograms of the noise levels during the baseline period for the averaged ERP parent waveforms and difference waveforms. Bins are 0.4 μV in width, and the x-axis indicates the midpoint value for each bin. (Right) Probability histograms of the noise levels during the measurement time window of the plus-minus average parent waveforms and difference waveforms. Bins are 0.4 μV in width, and the x-axis indicates the midpoint value for each bin.
