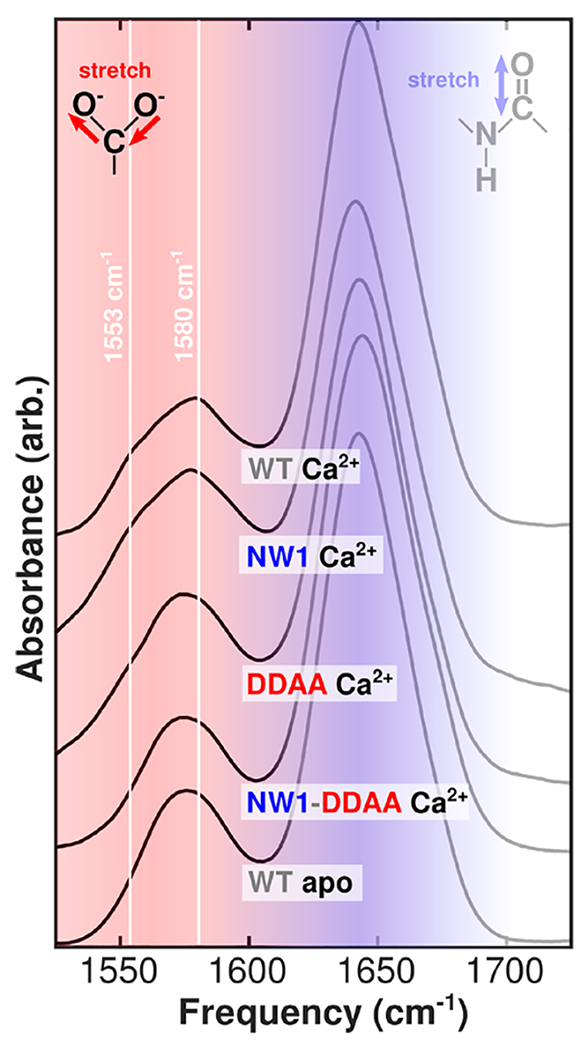
Figure 2.

Selected FTIR spectra of N-CaM bound to Ca2+ and Tb3+. Spectra for all structures are included in Figure S1, and corresponding second-derivative spectra are included in Figure S2. Solid white lines highlight peaks corresponding to different modes of carboxylate ion coordination in Ca2+-N-CaM. The bidentate glutamate peak is visible in the Ca2+-bound spectrum at 1553 cm−1, while the monodentate peak is visible at 1580 cm−1. Large, broad absorptions around 1640 cm−1 (shaded blue) are amide I modes in the protein backbone, which report on global structure. The carboxylate region centered around 1575 cm−1 (shaded red) reports on local structure in the ion binding sites and is highlighted as the focus of our study.
