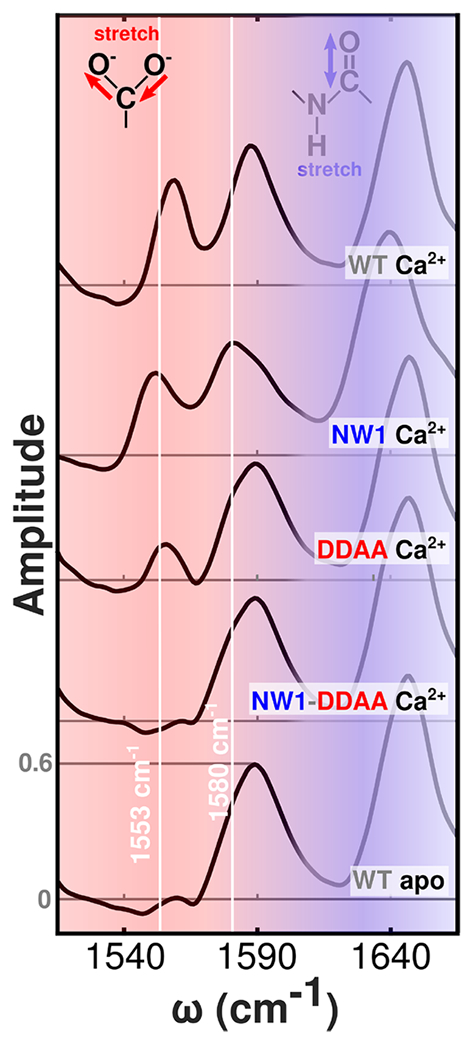
Figure 4.

Selected 2D IR diagonal slices of WT and mutant N-CaM bound to Ca2+ and Tb3+. These slices are extracted from the 2D IR data shown in Figure 3. The complete set of slices is included in Figure S3. To facilitate comparison with FTIR spectra, shading, frequency guide lines, and ordering of spectra are the same as in Figure 2. Note that the frequency axis is narrower than in Figure 2 due to the frequency range of the 2D IR measurements.
