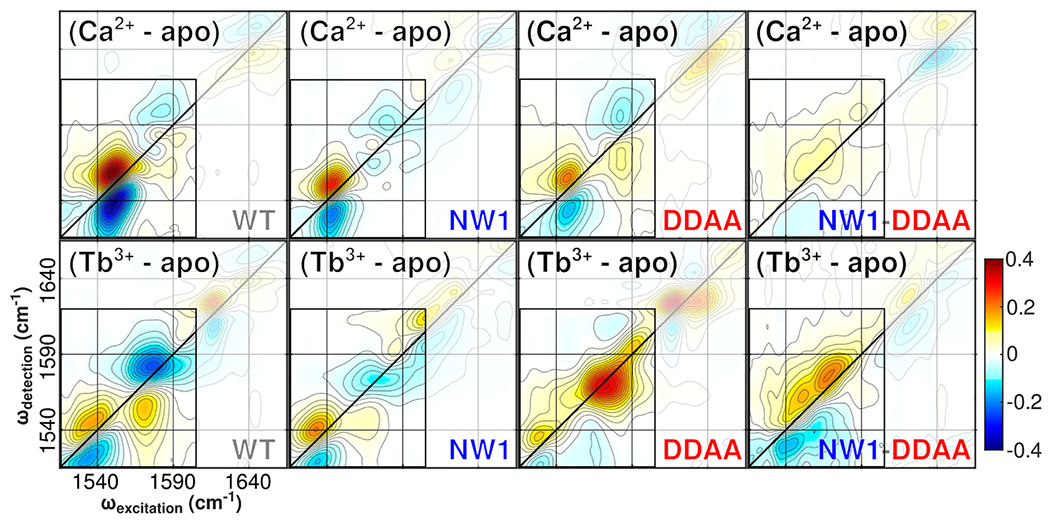
Figure 5.

2D IR difference spectra extracted from the 2D IR data shown in Figure 3. Difference spectra are calculated by subtracting the apo spectrum from the Ca2+ and Tb3+ spectra for each mutant. The difference spectra thus highlight the specific spectral signatures of Ca2+ and Tb3+ binding relative to the unbound protein. Note that the color scale covers a narrower range than in Figure 3 to highlight weaker features.
