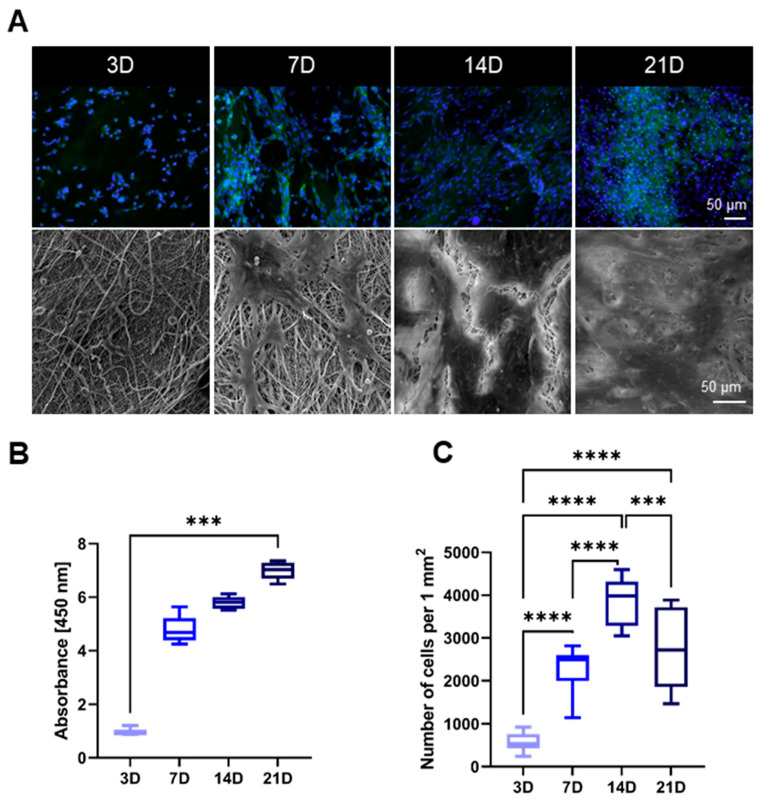
Figure 3.
Fluorescence microscopy images (blue cell nuclei and green actin cytoskeleton) and SEM images of the cells on the PCL scaffold after 3, 7, 14 and 21 days of the in vitro testing, scale bars 50 µm (A). The result of the colorimetric CCK-8 assay after the same time period, Kruskal–Wallis *** p = 0.0004. (B). Counted number of the cells on the surface of PCL materials per 1 mm2, ordinary one-way ANOVA, *** p < 0.0006, **** p = 0.0001 (C).

