Figure 2.
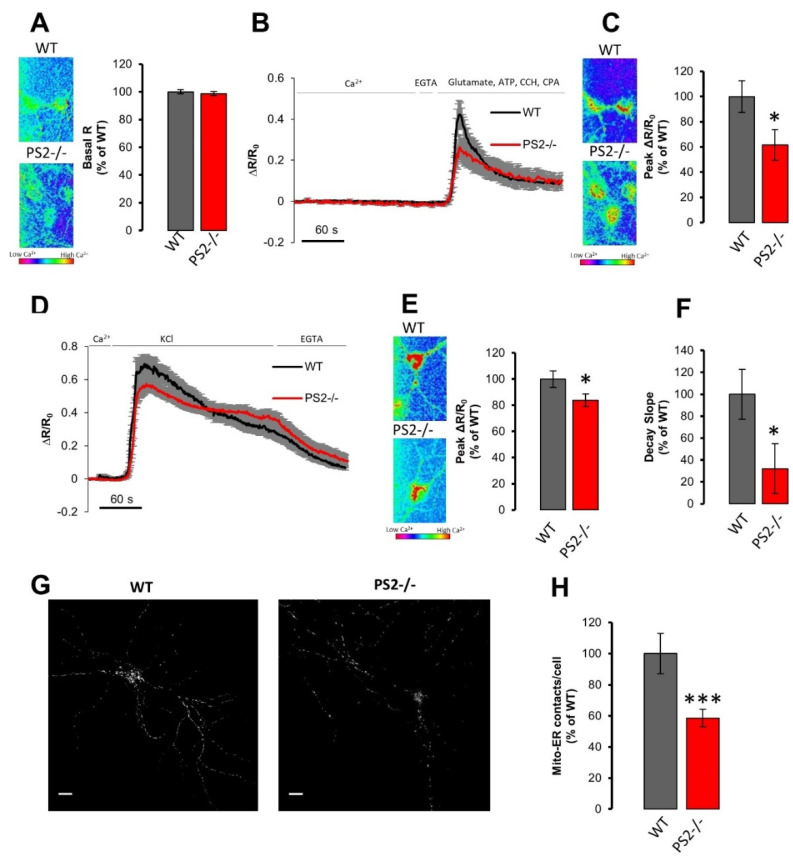
The lack of PS2 dampens mitochondrial Ca2+ uptake and reduces endoplasmic reticulum (ER)–mitochondria contact sites. (A) Left. The mitochondria resting [Ca2+] is visualized employing a pseudocolored scale as described in Figure 1A Right. The bar graph shows the mean basal R ± SEM of in WT (gray) or PS2–/– (red) cortical neurons expressing the mitochondrial Ca2+ probe 4mtD3mCerulean3+16, as a percentage of WT, obtained in WT (gray, n = 61 cells of 8 independent cultures) or PS2–/– (red, n = 72 cells of 8 independent cultures) cortical neurons. (B) Average traces of mitochondrial Ca2+ kinetics in WT (black) or PS2–/– (red) cortical neurons expressing the mitochondrial Ca2+ probe 4mtD3mCerulean3+16, bathed in mKRB and exposed to the mix of drugs described in Figure 1B, after 20 s of EGTA (0.6 mM)-containing mKRB perfusion. Data are shown as mean ± SEM of ΔR⁄R0 obtained in WT (n = 26 cells of 3 independent cultures) or PS2–/– (n = 19 cells of 3 independent cultures) cortical neurons. (C) Left. The mitochondria Ca2+ peak is visualized as described in Figure 1A. Right. The bar graph shows mean ± SEM of mitochondrial Ca2+ peak amplitude, as a percentage of WT, obtained in WT (gray) or PS2–/– (red) cortical neurons. * p < 0.05 (D) Average traces of mitochondrial Ca2+ kinetics in WT (black) or PS2–/– (red) cortical neurons expressing the mitochondria Ca2+ probe 4mtD3mCerulean3+16, bathed in mKRB and then perfused in KCl (30 mM)-containing iso-osmotic saline. Data are shown as mean ± SEM of ΔR⁄R0 obtained in WT (n = 35 cells of 5 independent cultures) or PS2–/– (n = 34 cells of 5 independent cultures) cortical neurons. (E,F) The bar graph shows, as a percentage of WT, obtained in WT (gray) or PS2–/– (red) cortical neurons, the mean ± SEM of (E) the mitochondrial Ca2+ peak amplitude (* p < 0.05) and of (F) the recovery phase slope (calculated by linear fit of the first 30 s of the decay phase, * p < 0.05). The mitochondria Ca2+ peak is visualized in panel E left as described in in Figure 1A. (G) Representative confocal images of WT (left) and PS2–/– (right) neurons infected with Adeno-Associated Virus (AAV)-human-synapsin (hSyn)-split-GFP-based contact site sensor (SPLICSs) probe. Scale bar 10 µm. (H) The bar graph shows the mean number of dots ± SEM obtained in WT (gray, n = 33 cells of 3 independent cultures) or PS2–/– (red, n = 34 cells of 3 independent cultures) cortical neurons (as a percentage of WT), *** p < 0.001.

