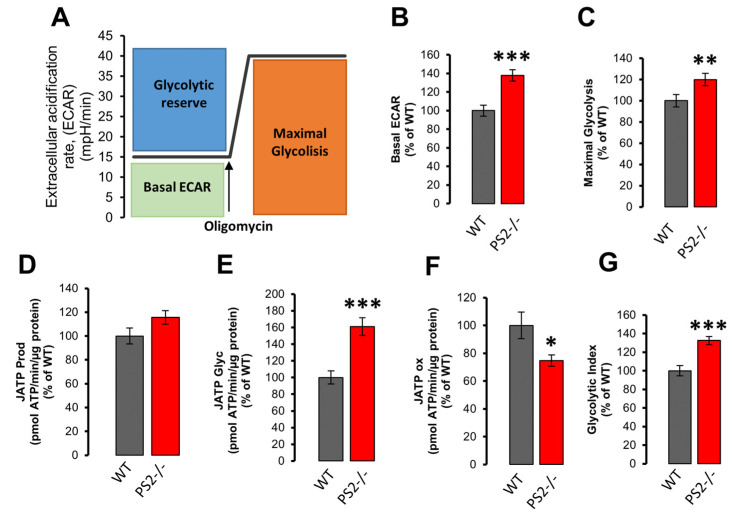
Figure 6.
The lack of PS2 induces a metabolic switch towards glycolysis. (A) Extracellular acidification rate (ECAR) experimental protocol. (B–E) The bar graph shows the mean ± SEM, as a percentage of WT, obtained in WT (gray) or PS2–/– (red) cortical neurons of: (B) the basal ECAR, *** p < 0.001; (C) the maximal glycolysis (calculated as mean of the ECAR reached upon oligomycin addition), ** p < 0.01; (D) the total ATP production rate (JATP Prod); (E) the glycolytic ATP production rate (JATP Glyc), *** p < 0.001; (F) the ATP production rate due to mitochondrial respiration (OXPHOS; JATP ox), * p < 0.05; (G) the Glycolytic Index (calculated as ratio between normalized JATP Glyc and JATP), *** p < 0.001.

