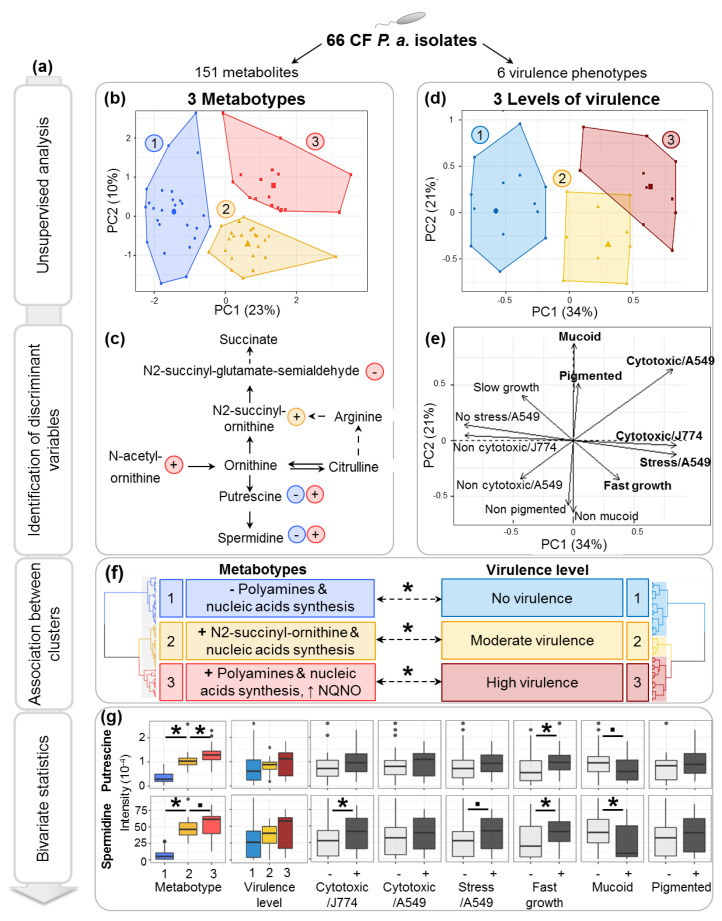
Figure 3.
Multiscale analysis identified associations between P.a metabotypes and expression of virulence phenotypes. (a) Summary of multiscale statistical workflow. (b) Representation of 3 HCPC clusters of isolates expressing similar metabolic profiles (metabotypes) in the first 2 PCs of the MFA. Cluster centroids are shown as larger dots. (c) Simplified view of the polyamines (putrescine, spermidine) synthesis pathway (adapted from [35]). Significant metabolites are highlighted by arrows, indicating whether the metabolite is found in higher or lower abundance in the color-matching metabotype. (d) Representation of 3 HCPC clusters of isolates expressing similar virulence phenotypes in the first 2 PCs of Multiple Correspondence Analysis (MCA). Clusters centroids are shown as larger dots. (e) Representation of the virulence categories in the first 2 PCs of the MCA. (f) Dendrograms and summary of the main characteristics of HCPC clusters identified on each data block and associations between P.a virulence level and metabotype (Fisher test p-values <0.05 are indicated by (*)). (g) Boxplots showing bivariate relationships between putrescine and spermidine levels with the expression of individual virulence factors (Student t test p-values <0.1 and <0.05 are indicated by (.) and (*), respectively).

