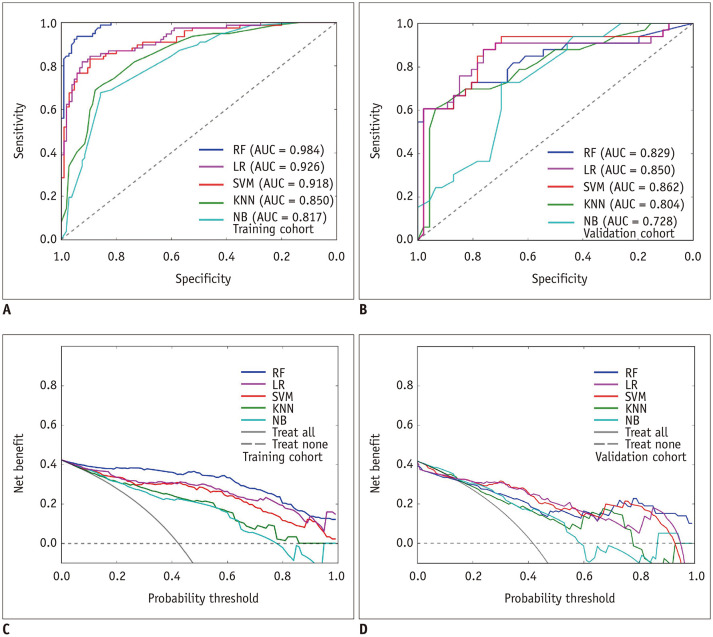
Fig. 4. ROC curves and decision curves of the five radiomics models for predicting hematoma expansion.
A, B. The ROC curves of the five radiomics models in the training cohort and in the validation cohort. C, D. The decision curves of the five radiomics models in the training cohort and in the validation cohort. KNN = k-nearest neighbors, LR = logistic regression, NB = naïve Bayes, RF = random forest, SVM = support vector machine

