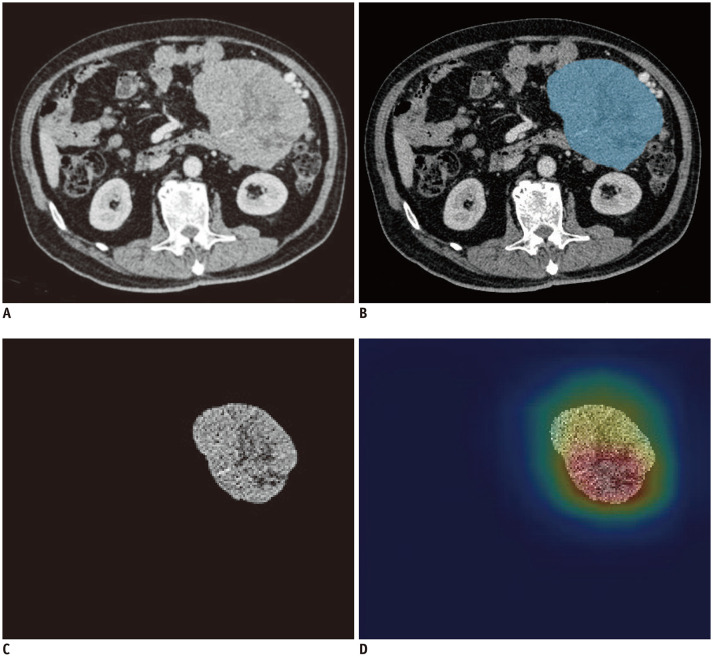
Fig. 2. A 72-year-old man with primary GIST.
Postoperative pathology showed a mitotic count of 8/50 HPFs. (A–C) showed the original axial CT image, segmented image, and pre-processed image of the tumor respectively. We used image labeling software to segment the tumor area in the CT image as the region of interest, which is the blue area in (B). Next, image preprocessing was performed on the basis of image segmentation and got the preprocessed image (C). The developed model predicted the image mitotic index classification and output the corresponding class activation heatmap (D).

