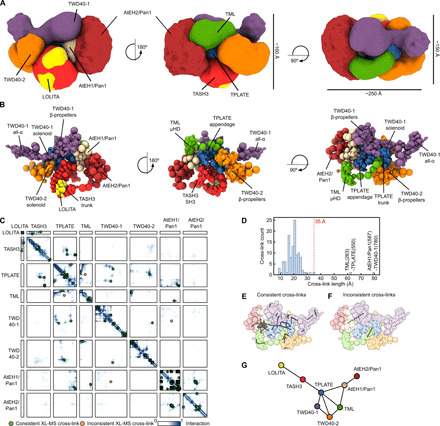
Fig. 2. The TPC structure reveals TPLATE as highly interconnected and centrally located.

(A) Architecture of TPC as obtained by the integrative modeling platform. The localization of each subunit is defined by a density map, visualized here at a threshold equal to 1/10 of the maximum. The localization density map represents the probability of any volume element being occupied by a given subunit. The approximate dimensions of TPC are 150 × 160 × 250 Å. (B) Architecture of TPC shown as a multiscale centroid structure, i.e., the structure with the minimal sum of root mean square deviations from all the good-scoring models in cluster 1. (C) The residue contact frequency map, calculated over 20 randomly selected models from cluster 1, is depicted by colors ranging from white (0, low frequency) to dark blue (1, high frequency). A contact between a pair of amino acid residues is defined by the distance between bead surfaces below 35 Å. Cross-links are plotted as green dots (consistent cross-links) or as orange dots (inconsistent cross-links). Each box represents the contact frequency between the corresponding pair of TPC subunits. (D) Distance distribution of obtained chemical cross-links in the centroid structure. The dotted red line represents the threshold for the consistent cross-links. Only 2 of 129 observed cross-links are violated (located right of the 35-Å border) in the TPC structure. (E) Consistent cross-links mapped on the centroid structure (gray lines). (F) Inconsistent cross-links mapped on the centroid structure (gray lines). (G) Chain-chain network diagram of the TPC structure. Nodes represent individual TPC subunits, and edges (lines) are drawn between nodes, which are chemically cross-linked. This reveals that TPLATE is a central hub interconnecting other TPC subunits.
