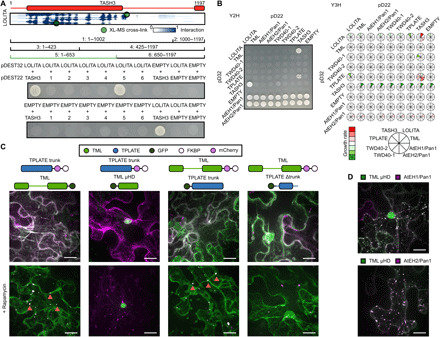
Fig. 3. Validation of TPC structure by heterologous and in planta interaction assays.

(A) Elucidation of the TASH3 interaction domain with the LOLITA subunit. Several TASH3 truncations (annotated as 1 to 6) were tested for their ability to interact with full-length LOLITA. None of the TASH3 constructs showed autoactivation when mated with an empty vector. Fragment 5, consisting of the trunk of TASH3, interacts strongly with LOLITA. The picture is representative of eight independent colonies. (B) Left: Representative Y2H matrix of all TPC subunits as well as with empty vectors used as autoactivation control. TASH3 interacts with both LOLITA and TPLATE. Both AtEH/Pan1 proteins strongly autoactivate. Right: Schematic visualization of the expansion of the Y2H with additional TPC subunit constructs without DNA binding or activation domain. Stronger interactions are indicated in green, and weakened interactions as compared to Y2H are indicated in red. Full images can be found in data file S6. (C) Representative Z-stack projected images of epidermal N. benthamiana cells transiently expressing various GFP-fused TML and TPLATE constructs, as well as mCherry-FKBP–fused TML and TPLATE constructs together with the MITO-TagBFP2-FRB* anchor. The used constructs are indicated above the image. Rapamycin induces relocalization of mCherry-FKBP–fused bait constructs to the mitochondrial anchor. The TPLATE trunk domain is sufficient for the TML-TPLATE interaction, and TML μHD is not involved in this interaction, as it displays no colocalization. Arrows indicate colocalization of both interacting constructs at the mitochondrial anchor. (D) TML μHD is recruited to AtEHs/Pan1-induced autophagosomes. The used constructs are indicated above the image. Scale bars, 10 μm.
