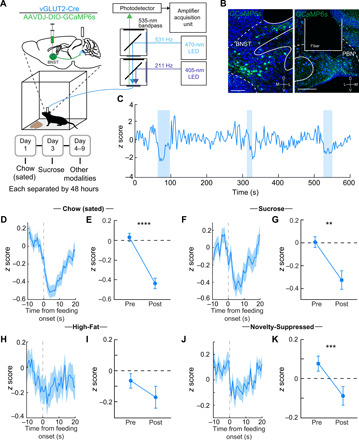
Fig. 3. An excitatory BNST-PBN circuit is disengaged during feeding.

(A) Schematic of in vivo fiber photometry and behavior. (B) Representative GCaMP6s expression in the BNST and PBN of a vGLUT2-Cre mouse. Scale bars, 100 μm (BNST) and 200 μm (PBN). (C) Representative responses of BNSTvGLUT2-PBN terminals during food consumption trials (high-sucrose chow; shaded areas represent periods of eating). (D and E) Average z-scored calcium response of BNSTvGLUT2-PBN terminals during consumption of normal chow under sated conditions (n = 133 bouts, six mice) and averaged activity of 10-s preconsumption compared to postconsumption initiation over the testing period. (F and G) Average z-scored calcium response of BNSTvGLUT2-PBN terminals during consumption of sucrose (n = 87 bouts, six mice) and averaged activity of 10-s preconsumption compared to postconsumption initiation over the testing period. (H and I) Average z-scored calcium response of BNSTvGLUT2-PBN terminals during consumption of high fat (n = 56 bouts, six mice) and averaged activity of 10-s preconsumption compared to postconsumption initiation over the testing period. (J and K) Average z-scored calcium response of BNSTvGLUT2-PBN terminals during consumption of normal chow under anxiogenic novelty-suppressed feeding conditions (n = 77 bouts, six mice) and averaged activity of 10-s preconsumption compared to postconsumption initiation over the testing period. **P < 0.01, ***P < 0.001, and ****P < 0.0001. Error bars indicate SEM. See also fig. S3.
