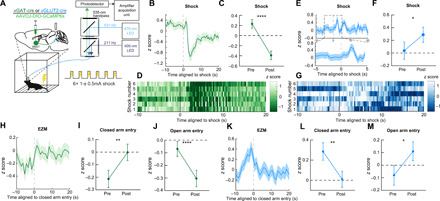
Fig. 4. Distinct BNST-PBN circuits display opposing responses to aversive stimuli.

(A) Schematic of in vivo fiber photometry and behavior. (B) Average z-scored calcium transient responses of BNSTvGAT-PBN terminals to an aversive shock (n = 7 mice). (C) Mean z-scored calcium transient responses of BNSTvGAT-PBN terminals (n = 7 mice) 10 s before and after the shock initiation. (D) Representative heatmap of BNSTvGAT-PBN terminal calcium transient activity of a single mouse during aversive shock presentation. (E) Average z-scored calcium transient responses of BNSTvGLUT2-PBN terminals to an aversive shock (n = 6 mice). (F) Mean z-scored calcium transient responses of BNSTvGLUT2-PBN terminals (n = 6 mice) 10 s before and after the shock initiation. (G) Representative heatmap of BNSTvGLUT2-PBN terminal calcium transient activity of a single mouse during aversive shock presentation. (H) Average z-scored calcium transient responses of BNSTvGAT-PBN terminals to entry into the closed arm of an EZM (n = 6 mice). (I) Mean z-scored calcium transient responses of BNSTvGAT-PBN terminals (n = 6 mice) 5 s before and after entry into the closed arm of an EZM. (J) Mean z-scored calcium transient responses of BNSTvGAT-PBN terminals (n = 6 mice) 5 s before and after entry into the open arm of an EZM. (K) Average z-scored calcium transient responses of BNSTvGLUT2-PBN terminals to entry into the closed arm of an EZM (n = 5 mice). (L) Mean z-scored calcium transient responses of BNSTvGLUT2-PBN terminals (n = 5 mice) 5 s before and after entry into the closed arm of an EZM. (M) Mean z-scored calcium transient responses of BNSTvGLUT2-PBN terminals (n = 5 mice) 5 s before and after entry into the open arm of an EZM. *P < 0.05, and **P < 0.01. Error bars indicate SEM. See also fig. S3.
