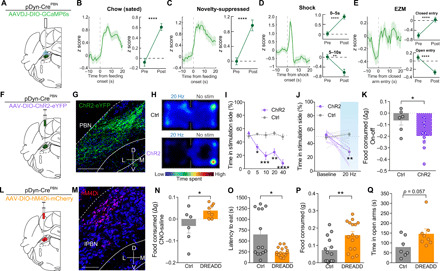
Fig. 7. Dynorphin-expressing PBN neurons mediate feeding and affective behavior.

(A) Schematic of in vivo fiber photometry. (B) Average z-scored calcium response of PBNpDyn terminals during consumption of normal chow under sated conditions (n = 68 bouts, six mice) and averaged activity of 10-s preconsumption versus postconsumption initiation. (C) Average z-scored calcium response of PBNpDyn terminals during consumption of normal chow under anxiogenic conditions (n = 39 bouts, six mice) and averaged activity of 10-s preconsumption versus postconsumption initiation. (D) Average z-scored calcium response of PBNpDyn terminals to an aversive shock (n = 25 bouts, six mice) and averaged activity of 5 s before shock initiation compared to 5 s after (top) and 5 to 10 s after (bottom) shock initiation. (E) Average z-scored calcium response of PBNpDyn terminals to entry into the closed arm of an EZM and averaged activity of 5 s before and after entry into the closed arm (top; n = 75 bouts, six mice) and open arm (bottom; n = 75 bouts, six mice). (F) Schematic of optogenetic approach to targeting PBNpDyn neurons. (G) ChR2-eYFP expression in PBNpDyn neurons. Scale bar, 200 μm. (H) Representative heatmaps of time spent in RTPP for Ctrl and PBNpDyn:ChR2 mice. (I and J) PBNpDyn activation elicits a real-time place aversion in a (I) frequency-dependent manner, including (J) 20 Hz (ChR2, n = 8; Ctrl, n = 6). (K) PBNpDyn activation decreases food consumption after food deprivation (ChR2, n = 8; Ctrl, n = 6). (L) Schematic of chemogenetic approach to targeting PBNpDyn neurons. (M) hM4Di-mCherry expression in PBNpDyn neurons. Scale bar, 100 μm. (N to Q) Chemogenetic inhibition of PBNpDyn neuron (N) increases food consumption and (O) decreases latency to eat while (P) increasing food consumed in a novelty-suppressed feeding task and (Q) increasing time spent in the open arms of EZM (DREADD, n = 7 to 8; Ctrl, n = 6 to 7). *P < 0.05, **P < 0.01, ***P < 0.001, and ****P < 0.0001. Error bars indicate SEM. See also fig. S5.
