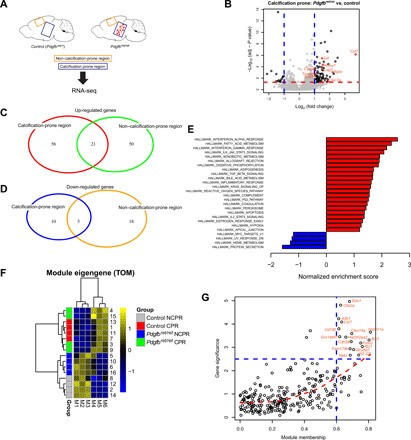
Fig. 1. An inflammatory microenvironment surrounds brain calcifications.

(A) Samples collected for transcriptome analysis. RNA-seq was performed from tissue isolated from two anatomical regions of Pdgfbret/ret and control animals (n = 4). Tissue enriched with brain calcifications was isolated from the thalamus/midbrain region labeled as calcification-prone region. Tissue isolated from the cortex is labeled as non–calcification-prone region. (B) Volcano plot showing deregulated genes in calcification-prone regions in Pdgfbret/ret animals compared to control animals. (C and D) Venn diagrams showing up-regulated (C) and down-regulated (D) genes in calcification-prone and non–calcification-prone regions. (E) Significantly up-regulated (in red) and down-regulated (in blue) pathways identified by gene set enrichment analysis (GSEA) (P < 0.05) in calcification-prone regions in Pdgfbret/ret animals compared to controls. (F) For each module identified by the network analysis, the module eigengene was calculated, which summarizes the expression profile of the module. The M4 module is associated with calcification-prone brain regions in Pdgfbret/ret mice. Heatmap shows column-wise standardized (z score) module eigengene values. CPR, calcification-prone region; NCPR, non–calcification-prone region; TOM, topological overlap matrix. (G) Graphical representation of representative hub genes with a high gene significance and module membership in the M4 module.
