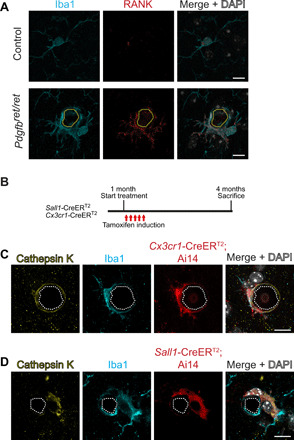
Fig. 4. Microglia give rise to cathepsin K–expressing cells around calcifications.

(A) Iba1-positive (in cyan) microglia around brain calcifications (encircled with yellow dotted lines) express the osteoclast marker RANK (in red). (B) Experimental setup of lineage tracing experiments. At 1 month of age, control and Pdgfbret/ret mice positive for Sall1-CreERT2; Ai14 or Cx3cr1-CreERT2; Ai14 were administered tamoxifen for five consecutive days and euthanized at 4 months of age. TdTomato expression was induced using inducible Cre lines where the expression of Cre is driven under Sall1 or Cx3cr1 promoter. (C and D) Cathepsin K staining (in yellow) colocalizes with tdTomato (in red) and Iba1 staining (in cyan) adjacent to calcification (encircled with white dotted lines). Nuclei were visualized using DAPI (in white; A, C, and D). Scale bars, 10 μm.
