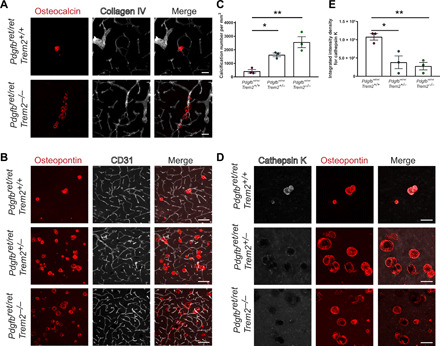
Fig. 7. TREM2-dependent microglial function is crucial in controlling vascular calcification.

(A) Altered pattern of vessel calcification in Pdgfbret/ret; Trem2−/− animals compared to Pdgfbret/ret; Trem2+/+ animals. Calcifications are visualized using osteocalcin staining (in red) and blood vessels using collagen IV staining (in white). (B) Pdgfbret/ret; Trem2−/− and Pdgfbret/ret; Trem2+/− animals show an increase in calcification load when compared to Pdgfbret/ret; Trem2+/+ animals. Vascular calcification is visualized with osteopontin (in red), and blood vessels are visualized using CD31 staining (in white). (C) Quantification of calcification using immunohistochemical stains [one-way analysis of variance (ANOVA) with Dunnett’s multiple comparison; *P = 0.0270 and **P = 0.0018). (D) Cathepsin K (in white) deposition in calcifications (osteopontin, in red) is reduced in Pdgfbret/ret; Trem2−/− and Pdgfbret/ret; Trem2+/− animals when compared to Pdgfbret/ret; Trem2+/+ animals. (E) Quantification of cathepsin K intensity with immunohistochemical stains (one-way ANOVA with Dunnett’s multiple comparison; *P = 0.0146 and **P = 0.0076). n = 3. Scale bars, 100 μm (B) and 50 μm (A and D). All data are presented as means ± SEM.
