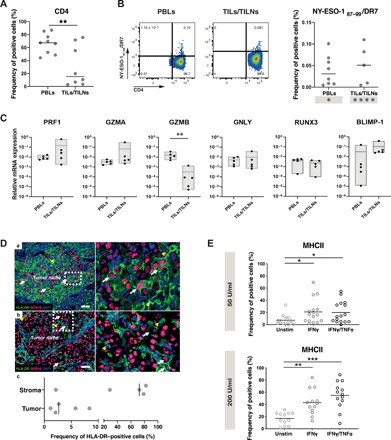
Fig. 2. Direct ex vivo detection of tumor-specific cytolytic CD4 T cells in patients with melanoma.

(A) Ex vivo frequency of CD4 T cells among PBLs and TILs/TILNs in patients with melanoma. (B) Representative examples (left) and summarizing graphs (right) of ex vivo pMHCII multimer staining of CD4 T cells specific for NY-ESO-187–99/DR7 obtained in PBL and TIL/TILN of HLA-DR7+ patient samples. (C) Quantitative reverse transcription PCR (RT-PCR) analysis of the indicated transcripts in ex vivo sorted NY-ESO-187–99/DR7 CD4 T cells isolated either from spell peripheral blood (PB) or TILs/TILNs. (D) Multispectral imaging assessment of MHCII expression directly in situ on 18 metastatic melanoma tissues. Representative examples of two cases (a) with expression of HLA-DR quantified to 5.8% of tumor cells within the SOX-10+ tumor niche (white arrows) and (b) lower expression of HLA-DR in 2.07% of the SOX-10+ tumor cells (white arrows). Stromal cells expressed HLA-DR, pointed by yellow arrowheads. The insets illustrate high-power images. The MSI were acquired using a 20× objective of the Vectra 3.0 imaging system. Scale bar, 50 μm. (c) Graph of frequency of HLA-DR–positive cells expressed in percentages, in the tumor SOX-10+ classified tissue category versus the stroma. DAPI, 4′,6-diamidino-2-phenylindole. (E) In vitro MHC II expression by 16 tumor cell lines after IFNγ and TNFα treatment. Statistical power was assessed using unpaired t test (A) and Kruskal-Wallis test (E).
