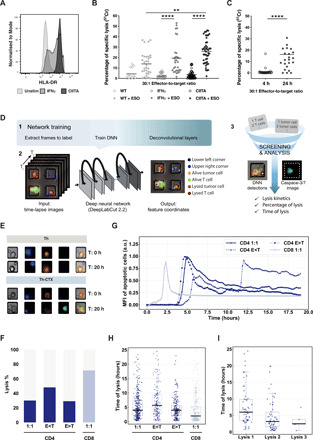
Fig. 3. Delayed but direct cytolytic capacity of NY-ESO-187–99/DR7 CD4 T cells against melanoma lines.

(A) Representative histogram of MHCII expression of a WT (light gray), IFN𝛾-treated (dark gray), and CIITA-transduced (black) tumor cell lines. FMO is shown as dashed line. (B) Cumulative analysis of 51Chromium release assays conducted with tumor cell lines transduced with CIITA, IFN𝛾 treated, or unmanipulated, pulsed or not with a specific peptide, and coincubated with PB (peripheral blood)–derived CD4 T cell clones. (C) Summary of the specific lysis obtained using a tumor cell line endogenously expressing NY-ESO-1 cocultured with PB-derived NY-ESO-187–99/DR7–specific CD4 T cell clones. Statistics were performed using nonparametric unpaired Kruskal-Wallis test (B) and matched-pairs signed-rank test (C). P values of <0.05 were considered statistically significant. (D) Single-cell tumor recognition assay using time-lapse imaging microscopy in picowell grids: Schematic illustration of the data analysis with deep learning approaches including the network training (1), video analysis for features extraction (2), and data screening and MFI analysis. DNN, deep neural network. (E to H) Fluorescently labeled CIITA–transduced tumor cell line pulsed with a specific peptide was cocultured with PB-derived NY-ESO-187–99/DR7 CD4 T cells in a PDMS picowell array. (E) Representative time series data at 0 and 20 hours of an enlarged view of two picowells showing CD4 T cells (blue), tumor cells (red), and the caspase-3/7 pathway reagent identifying cells undergoing apoptosis (green). (F) Cumulative analysis of average percentage of specific lysis, (G) real-time dynamic MFI of the tumor apoptosis, (H) the time of the lysis defined at a single cell level, and (I) time of the consecutive lytic events in wells with target cells outnumbering T cells. PB-derived NY-ESO-1157–165 /A2 CD8 T cells were used as positive control. a.u., arbitrary units.
