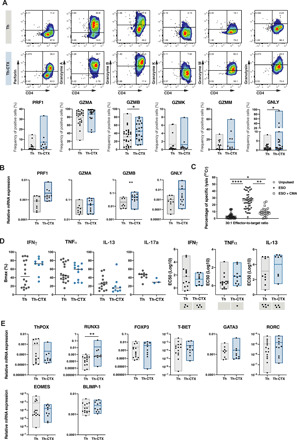
Fig. 4. The release of cytolytic molecules is mainly responsible for the cytolytic potential of tumor-specific CD4 T cells.

PB-derived NY-ESO-187–99/DR7–specific CD4 T cell clones were discriminated as Th or Th-CTX based on results obtained with a standard 4-hour 51Chromium release assay. (A) Representative example (top) and cumulative analysis (bottom) of the production of perforin (PRF1), granzymes (GZMA, GZMB, GZMK, and GZMM), and granulysin (GNLY) by NY-ESO-187–99/DR7–specific CD4 T cell clones. (B) Quantitative RT-PCR (qRT-PCR) analysis of the indicated transcripts in PB-derived NY-ESO-187–99/DR7 CD4 T cell clones. (C) Standard 4-hour 51Chromium release assay was conducted with a CIITA-transduced tumor cell line pulsed or not with a specific peptide. Release of perforin was blocked by a 2-hour pretreatment of antigen-specific CD4 T cells with CMA (100 nM). Results are expressed as percentage of specific lysis of the target cells at 30:1 E:T ratio. Statistics were performed using nonparametric unpaired Kruskal-Wallis test. (D) Average dose-response curves and Bmax (maximal response), EC50 values of IFNγ, TNFα, IL-13, and IL-17a induced by titrated concentrations of NY-ESO-187–99 peptide by PB-derived NY-ESO-187–99/DR7–specific CD4 T cell clones. (E) Quantitative RT-PCR analysis of the indicated transcripts in PB-derived NY-ESO-187–99/DR7 CD4 T cell clones. All statistics for RT-PCR data were performed using two-way analysis of variance (ANOVA) with Sidak’s post hoc test.
