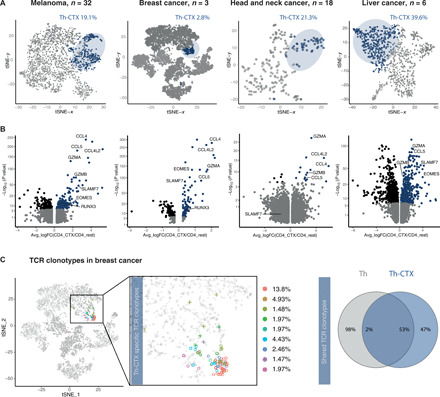
Fig. 7. Distribution of cytolytic CD4 T cells across cancer types and their relatedness to other T helper clusters.

(A) tSNE 2D plot of scRNA-seq data representing the CD4+ T cell clusters discriminating the cytolytic (dark blue) and noncytolytic (gray) subsets across patients with melanoma, BC, head and neck cancer, and hepatocellular carcinoma. (B) Volcano plot analysis of gene expression changes in melanoma, BC, head and neck cancer, and hepatocellular carcinoma patients from Th-CTX compared to other Th clusters. Statistical power was assessed using Wilcoxon test [gray, P ≥ 0.01; blue, log fold change (logFC) > 0.25 and P < 0.01; black, logFC ≤ 0.25 and P < 0.01]. (C) 2D tSNE of scRNA-seq data representing the most abundant TCR clonotypes identified in the CD4_Cytolytic cluster in patients with BC, their relative abundance (left), and Venn diagram showing the distribution of unique and overlapping TCR sequences and their relative abundance across Th-CTX and non–Th-CTX (right).
