
Fig. 1. Transcriptional dynamics in IAM after SCI.
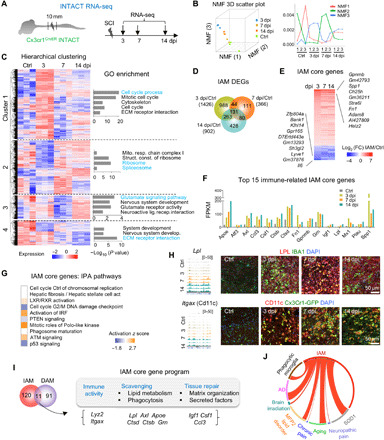
(A) Experimental paradigm. (B) Left: NMF three-dimensional (3D) scatter plot. Right: NMF line plot revealing three metagenes representing distinct transcriptional programs. Y axis, expression of NMF metagenes. (C) Hierarchical clustering identified four gene clusters in IAM. Heatmap of gene expression levels shown as row normalized z-score values. Enriched GO terms shown on right. (D) Venn diagram displaying unique and overlapping DEGs in IAM. (E) Heatmap showing transcriptional changes of 131 core IAM genes common to all time points after SCI relative to control microglia. FC, fold change. Top 10 up- and down-regulated genes in IAM are listed. (F) Absolute expression levels of 15 selected significantly regulated immune system–related genes in the core IAM gene program [fragments per kilobase of exons per million mapped reads (FPKM) averaged from triplicates for each time point]. (G) Pathway enrichment of the IAM core genes by IPA, ranked by adjusted P value. IPA, ingenuity pathway analysis. (H) RNA-seq read coverage tracks (left) and IHC images (right) showing expression of LPL and CD11c in myeloid cells (green) after SCI. (I) Venn diagram showing overlap of IAM and DAM signature genes: 11 genes grouped by distinct functions during progressive IAM activation. (J) Circos plot of connectivity map of IAM gene signatures with gene sets of activated microglia in CNS disease models. Lines represent pairwise dataset overlaps.