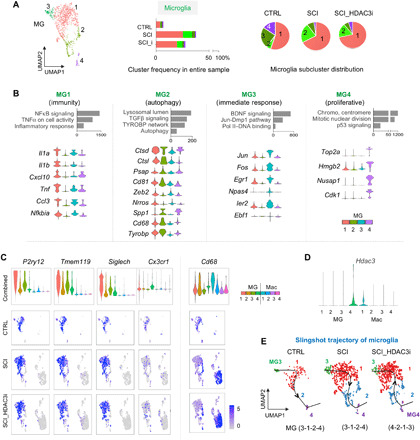
Fig. 6. Functional specialization and trajectory of microglia transformation in SCI.

(A) Left: UMAP plot of microglia subclusters (MG1 to MG4). Middle: Graphs showing relative abundance of MG1 to MG4 as compared to all cells in the entire sample in each condition. Right: Pie charts showing relative proportions of MG1 to MG4 among microglia in each condition. n = 187 microglia in CTRL, 512 in SCI, and 510 in SCI_HDAC3i. (B) Enriched GO terms associated with the top 30 up-regulated marker genes for each microglia subcluster. Bottom: Violin plots showing expression of selected marker genes related to the pathway ontologies indicated above. (C) Violin and UMAP plots show heterogeneous expression patterns of microglial markers genes and phagocytic marker Cd68. (D) Expression of Hdac3 in myeloid subclusters, shown by violin plot. Note a preferential expression of Hdac3 in MG4. (E) Single-cell trajectory analysis of microglia transformation under each condition using Slingshot software platform. HDAC3i influences lineage trajectories of microglia, with the starting point shifted from MG3 to MG4.
