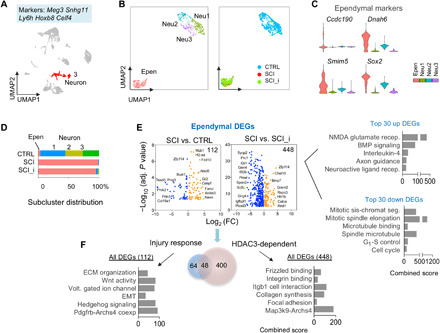
Fig. 8. Injury response genes and HDAC3 dependence in ependymal cells after SCI.

(A) UMAP plot showing all cells in adult spinal cord, with neuronal cluster highlighted in red. Highly expressed marker genes are indicated above. The neuronal cluster contained 942 cells in total: 638 in CTRL, 86 in SCI, and 218 in SCI_HDAC3i. (B) Left: UMAP plot of neuronal subclusters distinguishes an ependymal cell population (Epen) from the eneuronal population (Neu1 to Neu3). Right: UMAP plot showing the four subclusters color-coded for each condition. (C) Expression of marker genes for the ependymal subcluster, shown as violin plots. (D) Bar graphs of subcluster distributions revealed ependymal expansion but neuronal depletion after SCI. (E) Volcano plots showing DEGs of ependymal cells in SCI versus CTRL (injury response) and SCI versus SCI_HDAC3i (HDAC3 dependence). Total number of DEGs is indicated at the top right corner. n = 21 ependymal cells in CTRL, 85 in SCI, and 207 in SCI_HDAC3i. (F) Left: Enriched ontology terms and pathways associated with ependymal injury response DEGs, or HDAC3-regulated genes in reactive ependymal cells. Right: Enriched ontology terms and pathways associated with the top 30 up- or down-regulated HDAC3-dependent genes in reactive ependymal cells (SCI versus SCI_HDAC3i). EMT, epithelial-mesenchymal transition.
