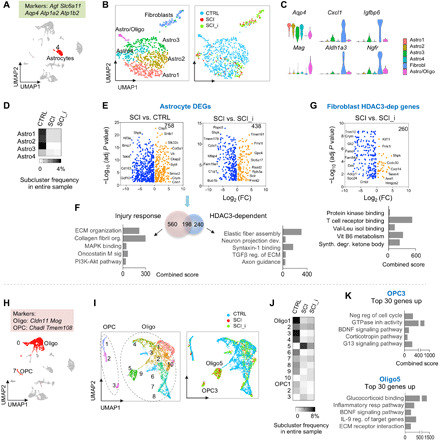
Fig. 9. Glial transcriptional responses and HDAC3 dependence in SCI.

(A) UMAP plot, astrocyte cluster highlighted in red, and highly expressed marker genes indicated on top. n = 905 astrocytes. (B) UMAP plot of astrocyte cluster showing six subclusters. Right: Subclusters color-coded for each condition. (C) Violin plots showing expression of marker genes for astrocyte subclusters. (D) Frequency heatmap showing astrocyte subcluster proportions relative to all cells in entire sample in each condition. (E) Volcano plots showing DEGs in astrocytes (Astro1 to Astro4) of the indicated comparisons. n = 621 astrocytes in CTRL, 76 in SCI, and 121 in SCI_HDAC3i. (F) Venn diagram and pathway enrichment of injury response genes and HDAC3-regulated genes in reactive astrocytes. (G) Volcano plot and pathway enrichment of HDAC3-dependent DEGs in fibroblasts in SCI. n = 28 in SCI and 57 in SCI_HDAC3i. (H) UMAP plot, oligodendrocyte, and OPC clusters highlighted in red. Highly expressed marker genes are indicated above. n = 2815 oligodendrocytes and 318 OPCs. (I) UMAP plot showing subclusters of OPC and oligodendrocytes. Right: Subclusters color-coded for each condition. (J) Frequency heatmap showing subclusters proportion relative to all cells in entire sample in each condition. (K) Ontology and pathway enrichment of the top 30 DEGs in subcluster OPC3 (versus other OPC subclusters) and Oligo5 (versus other Oligo subclusters). GTPase, guanosine triphosphatase; BDNF, brain-derived neurotrophic factor.
