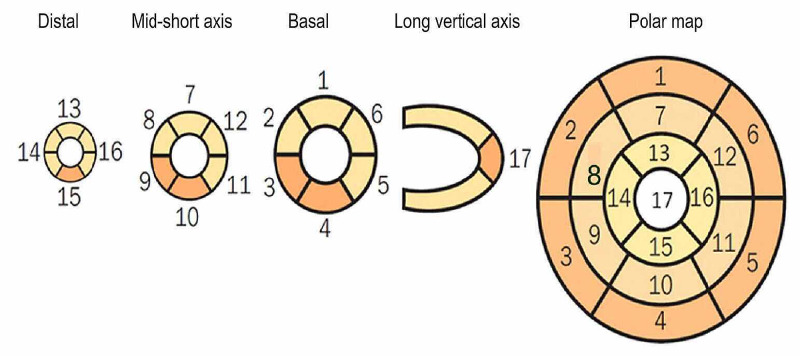
Figure 4. Numerical segmentation model of the left ventricular myocardium in 17 segments.
Considering the tomographic slices of the minor and long vertical axes (distal or apical, middle, and basal or proximal portions), representing the myocardial regions. Furthermore, correspondence of segments may be seen as presented in the polar map, which represents radiopharmaceutical distribution throughout the left ventricular myocardium in the form of a polar map, whose center corresponds to the apex and whose peripheries correspond to the basal portions [24].

