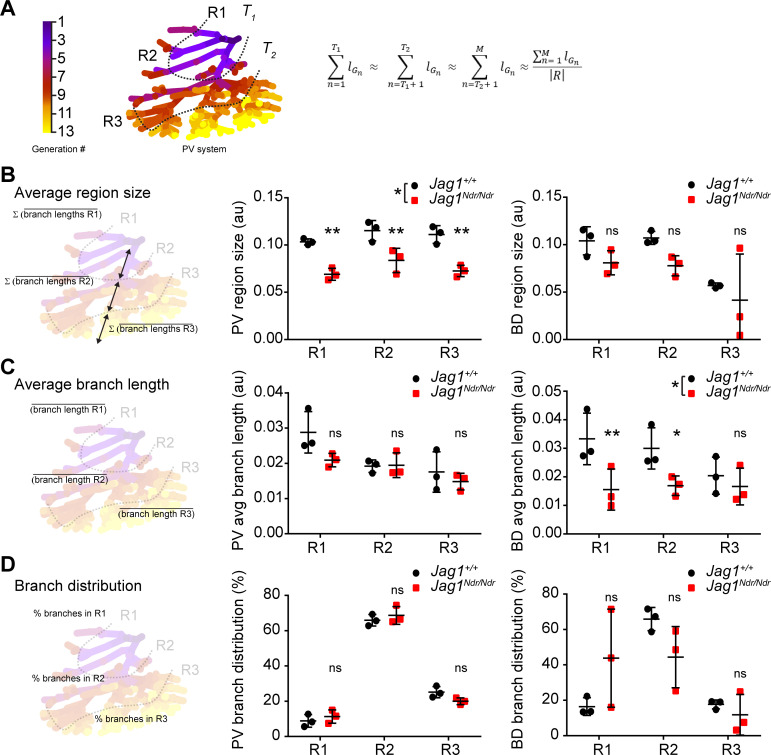
Figure 5. Strahler analysis of resin casts reveal excess central branching in the Jag1Ndr/Ndr de novo generated biliary system.
(A) 3D branching analysis based on Strahler number. The branching generations were divided into three equal regions: R1, R2 and R3 based on portal vein average branch length and generation number. Formula: R = {R1, R2, R3}; n ∈ [1, M] ⊂ ℕ; T1, T2⊂ n; R, region; G, branch generation; M, maximal branch generation number; lGn, average branch length of nth generation; T1, T2, borders between regions (specific generation number). (B) Schematic representation of region size calculation, deriving the sum of the average branch lengths within a given region (left). Liver region size for PV (middle panel) and BD (right panel). (C) Schematic representation of average branch length calculation within a region (left panel). Average branch length analysis for PV (middle panel) and BD (right panel) system. (D) Schematic representation of branch distribution, deriving the percentage of branches belonging to each region (left panel). Percentage of branches in each liver region in PV (middle panel) and BD (right panel) systems. Each dot represents one animal, bars represent mean ± standard deviation. Two-way ANOVA, (B) middle panel p = 0.0289, right panel p = 0.2029; (C) middle panel p = 0.1177, right panel p = 0.0367; (D) middle panel p = 0.4226, right panel p = 0.8845; followed by Sidak's multiple comparisons test, p < 0.05 (*), p < 0.01 (**), ns not significant. au, arbitrary units; BD, bile duct; PV, portal vein.


