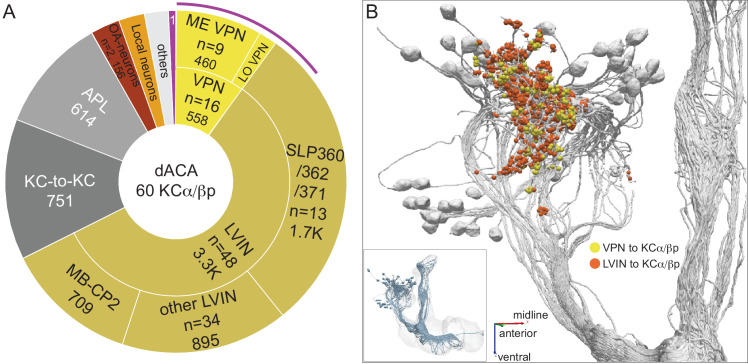
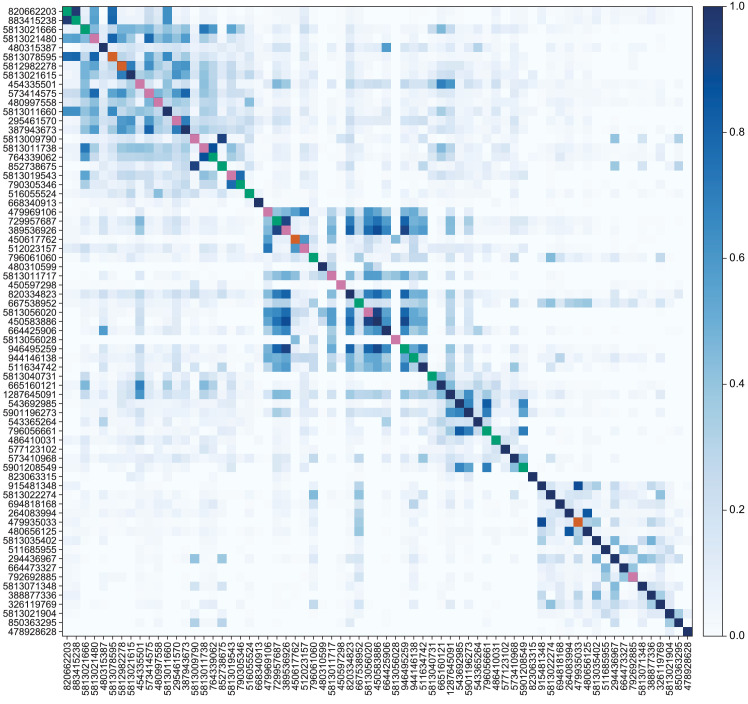
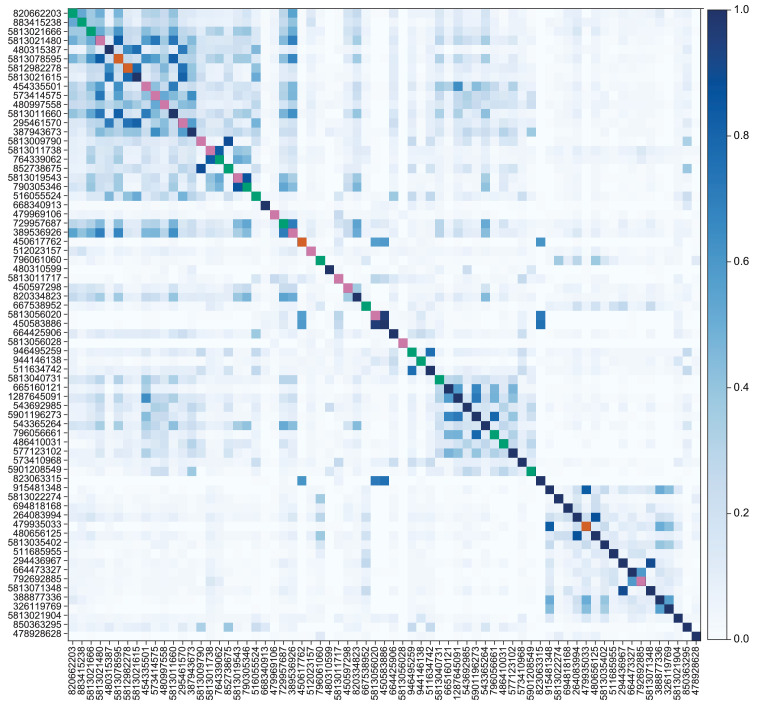
Figure 11. Dorsal accessory calyx (dACA).
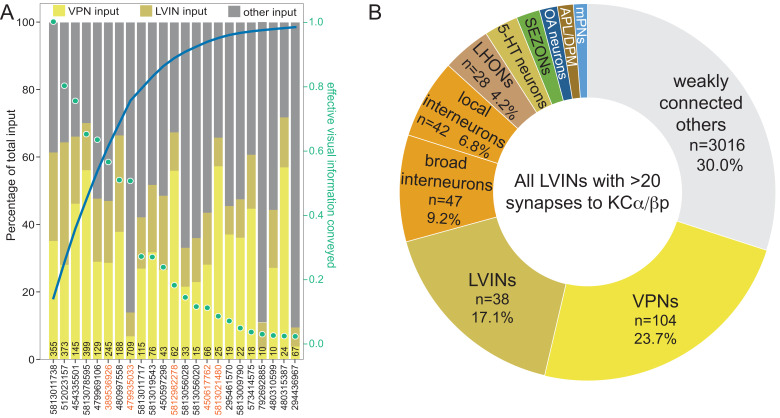
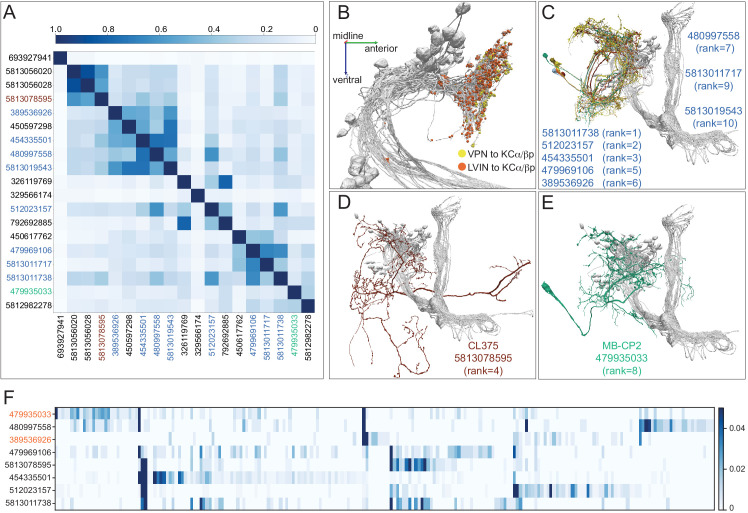
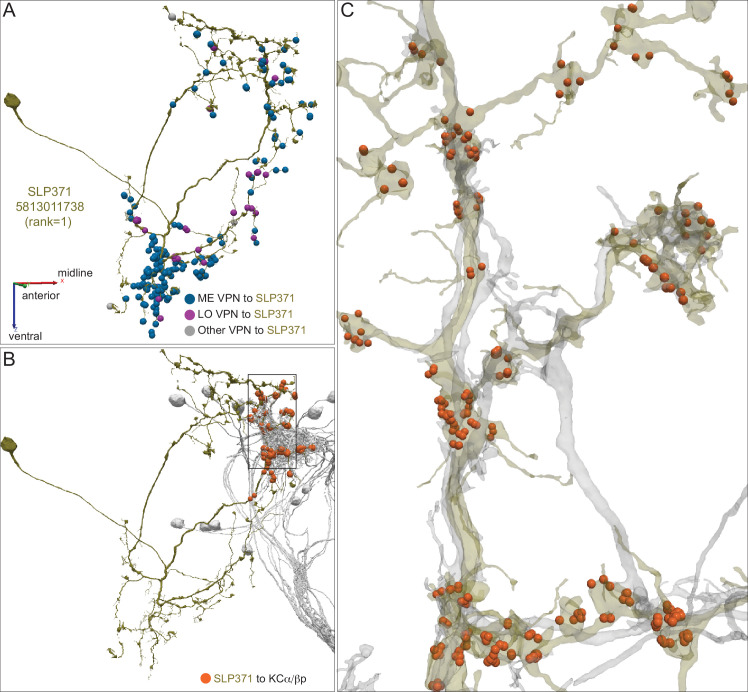
The dendrites of the 60 α/βp KCs define the dACA. The pie chart shows a breakdown of the inputs to these KCs. The majority convey visual information, either directly from visual projection neurons (VPN; 9.8%) or through intermediate local visual interneurons (LVIN; 57.8%) that receive input from VPNs (see Figure 11—figure supplement 1). VPNs can be subdivided based on the location of their dendrites in either ME or LO, as indicated in the outer circle. More than two-thirds of the indirect input is mediated by the LVIN cell types SLP360, SLP362, and SLP371, shown in Figure 11—figure supplement 2C; this SLP360/361/371 cluster of 13 neurons contributes about 30% of total input to the 60 α/βp KCs in the dACA. Neurons of similar morphology have also been observed to be presynaptic to KCα/βp in the dACA in a recent study (Li et al., 2020). Another LVIN, MB-CP2 (LHPV3c1) (479935033), provides 12.6% of the input to KCs in the dACA; however, only a small percentage of its inputs are visual (see Figure 11—figure supplement 1A and 2E). The total visual information presented to KCs by VPNs and LVINs is indicated by the purple arc around the outer layer; it reflects the direct input from the VPNs plus the fraction of the LVIN input that represents visual input. The next most prominent inputs are KC-to-KC synapses in the dACA (13.3%), from APL (10.9%), from two octopaminergic neurons (2.8%; OA-VPM3, see Figure 3—figure supplement 1D, and OA-VUMa2, see Figure 3—figure supplement 1F); and local interneurons (n = 23; 2.3%). Remaining input, ‘others’, are input from 102 different neurons that are all weakly connected; and numbered sector 1 are mPNs (0.7%). The dendrites of KCα/βp neurons in the dACA (Tanaka et al., 2008; Zhu et al., 2003) are reportedly activated by bitter or sweet tastants (Kirkhart and Scott, 2015). However, the KCα/βp are not required for taste conditioning, which instead appears to depend on γ KCs (Kirkhart and Scott, 2015) and we were unable to identify strong candidates for delivering gustatory sensory information to the dACA. The PN VP5+Z adPN (5813063239) connects to two α/βp KCs has dendrites in the SEZ (Figure 9—figure supplement 3). But this is the only gustatory PN we can associate with the dACA, and it primarily projects to KCγm neurons through which it might participate in conditioned taste aversion (Kirkhart and Scott, 2015). (B) Color-coded synaptic connections from visual projection neurons (VPN; yellow) and local visual interneurons (LVIN; orange) onto α/βp KCs (gray). Note that, unlike in the vACA, there are more connections from LVINs than VPNs in the dACA.

