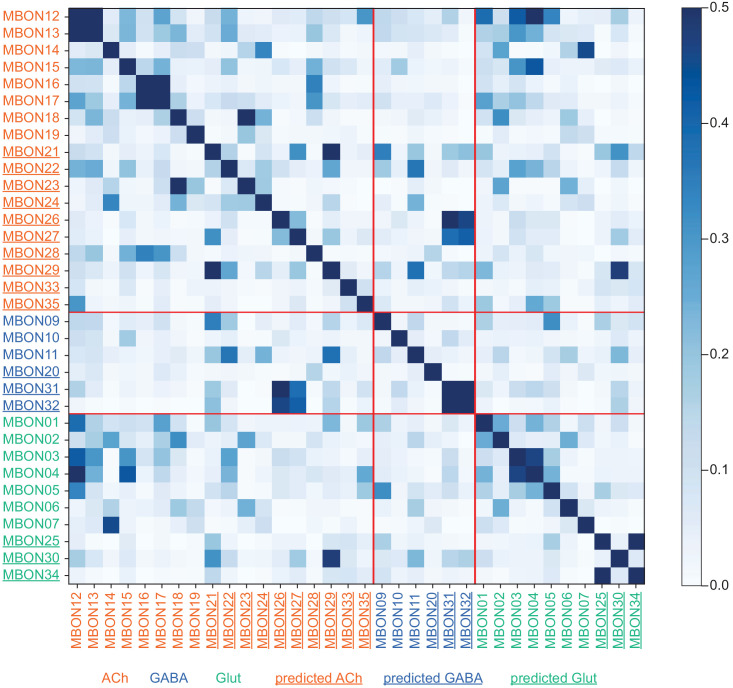
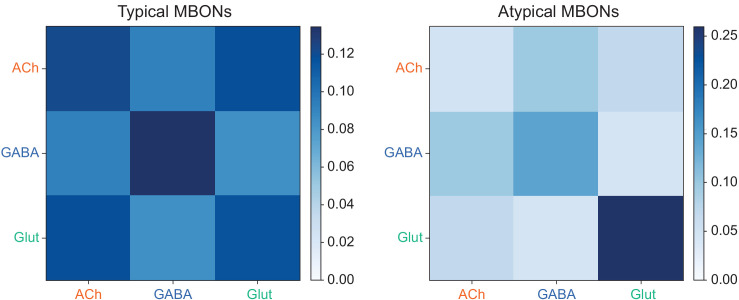
Figure 17. MBON output similarity by neurotransmitter.
Cosine similarity of MBON outputs to all named neurons. MBONs have been grouped by neurotransmitter and then presented in numerical order. There exist many instances of convergent outputs between cholinergic and glutamatergic neurons, suggesting a widespread ‘push-pull’ motif in MBON output convergence patterns. This phenomenon is emphasized in Figure 17—figure supplement 1 and notable examples are explored in further detail in Figure 20—figure supplement 1 and Figure 21—figure supplements 1,2. The MBON names are color-coded by neurotransmitter with predicted transmitters underlined.


